How to utilise timeseries in pandas?
Last Updated :
28 Feb, 2022
An ordered stream of values for a variable at evenly spaced time periods is known as a time series. Timeseries are useful in identifying the underlying factors and structures that resulted in the observed data and After you’ve fitted a model, one can move on to forecasting, monitoring. some applications of time series are Analysis of the Stock Market, Estimated Yields, studies of the spread of diseases like covid19 etc. We can use time series to a particular data based on certain conditions. In this article let’s demonstrate how to use time-series data.
Click here to view and download the dataset.
Utilize timeseries in Pandas
All the examples are made on covid_19 data. After importing the CSV file ‘ObservationDate’ and ‘Last Update’ dates are converted to datetime using pd.to_datetime() method.
Python3
import pandas as pd
df = pd.read_csv('covid_19.csv', encoding='UTF-8')
df['ObservationDate'] = pd.to_datetime(df['ObservationDate'])
df['Last Update'] = pd.to_datetime(df['Last Update'])
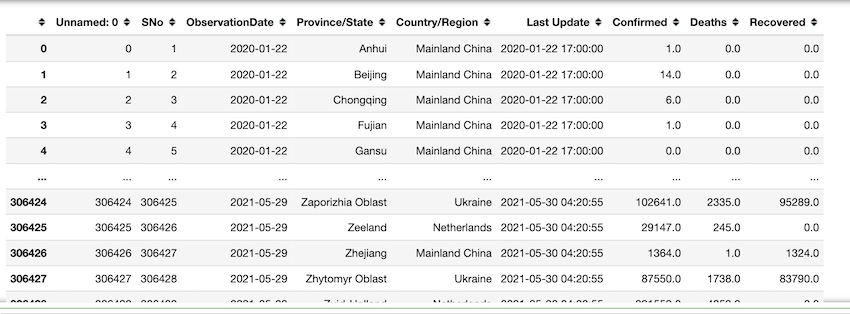
print(df)
|
Output:
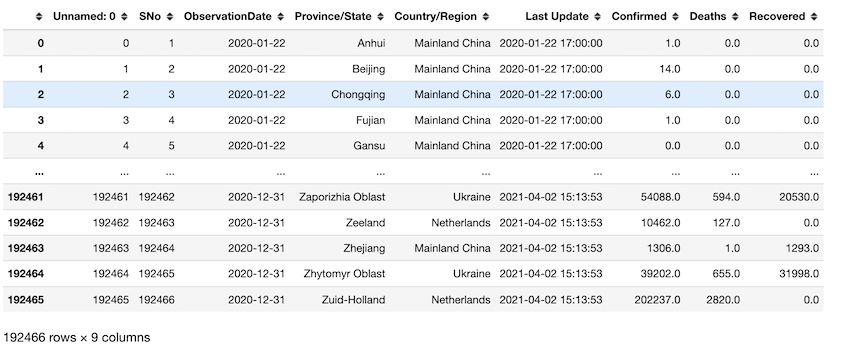
Extract all observations before 2021. 192466 rows are retrieved.
Python3
df[df['ObservationDate']<='2021']
|
Output:
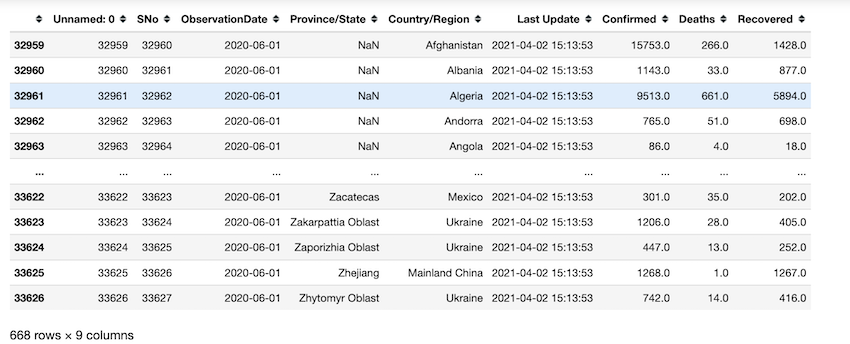
Retrieving observations of a particular day. in this example, we set the day to be ‘2020-06’.
Python3
df[df['ObservationDate'] == '2020-06']
|
Output:
Retrieving the day where maximum deaths are the highest. on 2021-05-29 maximum deaths are recorded from UK as per our data.
Python3
df[df['Deaths'] == max(df['Deaths'])]
|
Output:

Output
Sum of all the deaths on ‘2021-05-20’.
Python3
sum(df[df['ObservationDate'] == '2021-05-20']['Deaths'])
|
Output:
3430539.0
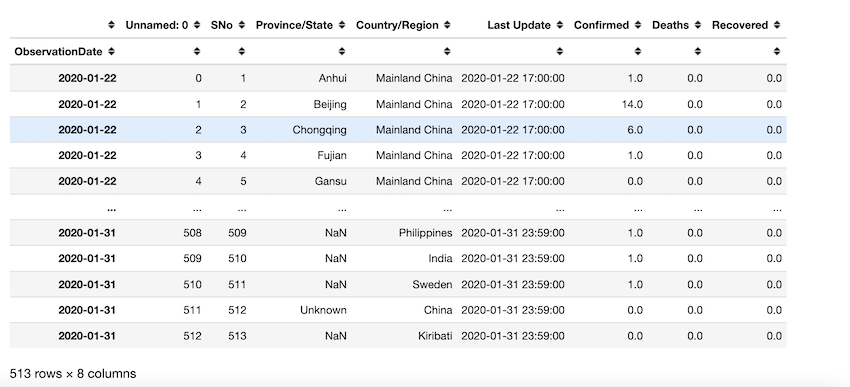
Instead of working on the hard way to retrieve data, we can set time series columns to datetime and set them as the index of the dataframe to easily retrieve the information we need. ObservationDate is set as the index of the dataframe in this example. by using df.loc() we can index and access required information by dates directly. df.loc[‘2020-01’] retrieves all the data of that date. The output shows that there are 513 observations.
Python3
import pandas as pd
df = pd.read_csv('covid_19.csv')
df['ObservationDate'] = pd.to_datetime(df['ObservationDate'])
df['Last Update'] = pd.to_datetime(df['Last Update'])
df = df.set_index('ObservationDate')
print(df.loc['2020-01'])
|
Output:
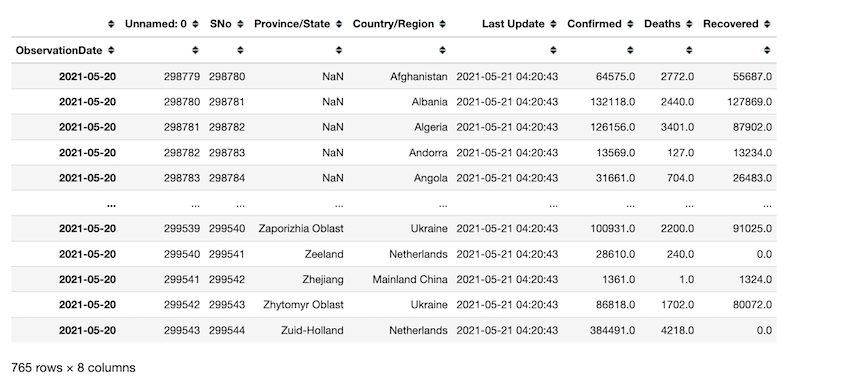
Observations taken from may 20th to may 21st of 2021 are retrieved using indexing.
Python3
import pandas as pd
df = pd.read_csv('covid_19.csv')
df['ObservationDate'] = pd.to_datetime(df['ObservationDate'])
df['Last Update'] = pd.to_datetime(df['Last Update'])
df = df.set_index('ObservationDate')
df.loc['2021-05-20':'2021-05-21']
|
Output:
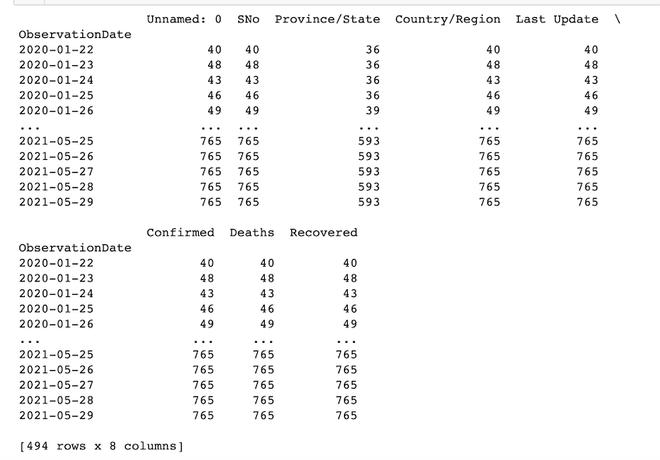
In this example, df.groupby() is used to group all the observations based on the date they got updated and count them. for example, the first row says there are 40 observations on ‘2020-01-22’.
Python3
import pandas as pd
df = pd.read_csv('covid_19.csv')
df['ObservationDate'] = pd.to_datetime(df['ObservationDate'])
df['Last Update'] = pd.to_datetime(df['Last Update'])
df = df.set_index('ObservationDate')
print(df.groupby(level=0).count())
|
Output:
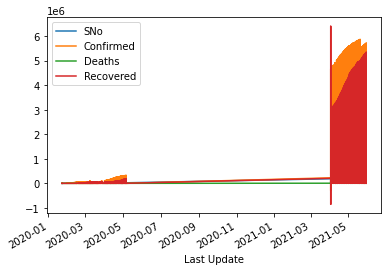
After setting the index of the dataframe to time-series, we use df.plot.line() method to visualize all the information through a single line plot. Time series data helps us make good conclusions.
Python3
import pandas as pd
from matplotlib import pyplot as plt
import numpy as np
df = pd.read_csv('covid_19_data.csv', encoding='UTF-8')
df['Last Update'] = pd.to_datetime(df['Last Update'])
df.set_index('Last Update', inplace=True)
df.plot.line()
|
Output:
Like Article
Suggest improvement
Share your thoughts in the comments
Please Login to comment...