How to Use the Jitter Function in R for Scatterplots?
Last Updated :
24 Feb, 2022
In this article, we will discuss how to use the jitter function in the R programming Language for Scatterplots.
Scatterplots is a visualization plot that uses cartesian coordinates to display values for typically two variables for a set of data by having them at the x-axis and the y-axis. This is very helpful in understanding the relationship between variables and figuring out trends in data. But if we are visualizing the relationship between one continuous variable and another variable that is almost continuous, the scatter plot fails to give a good visualization as points are confined in groups and are indistinguishable.
The CSV file used in the example can be downloaded from here.
Example: Scatterplot
R
df <- read.csv("Sample_data.CSV")
plot( df$var1, df$var2, col = 'green')
|
Output:
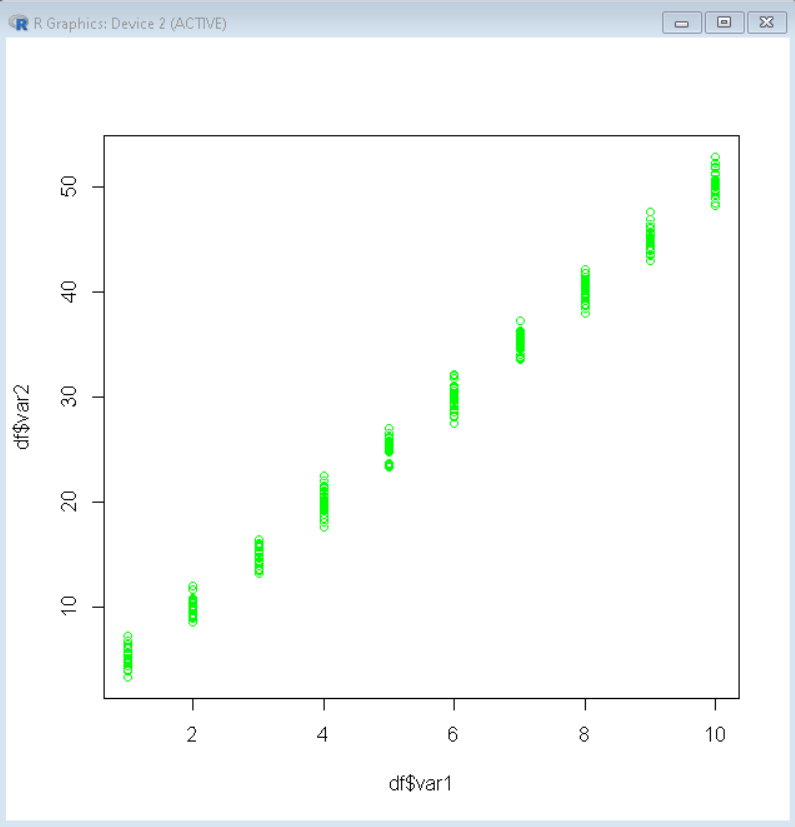
Since here data in the y-axis is also nearly continuous it is very hard to visualize trends in grouped data. For this situation, we use the jitter function. The jitter() function is used to add noise to the numeric vector. The jitter() function takes a numeric vector and amount of noise to be added and returns a numeric vector of the same length but with an amount of noise added in order to break ties.
Syntax:
jitter( numeric_vector, amount )
where,
- numeric_vector: determines the input vector in which noise is to be added.
- amount: determines the amount of noise to be added to the input vector.
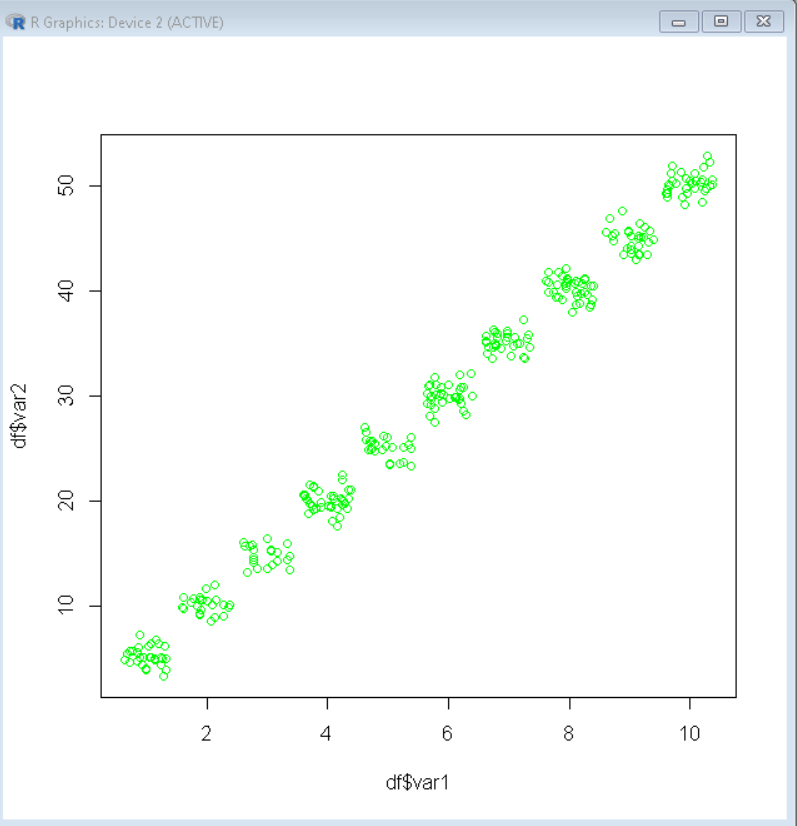
Example: Scatter plot with a jitter function.
R
df <- read.csv("Sample_data.CSV")
df$var1 <- jitter(df$var1, 2)
plot( df$var1, df$var2, col = 'green')
|
Output:
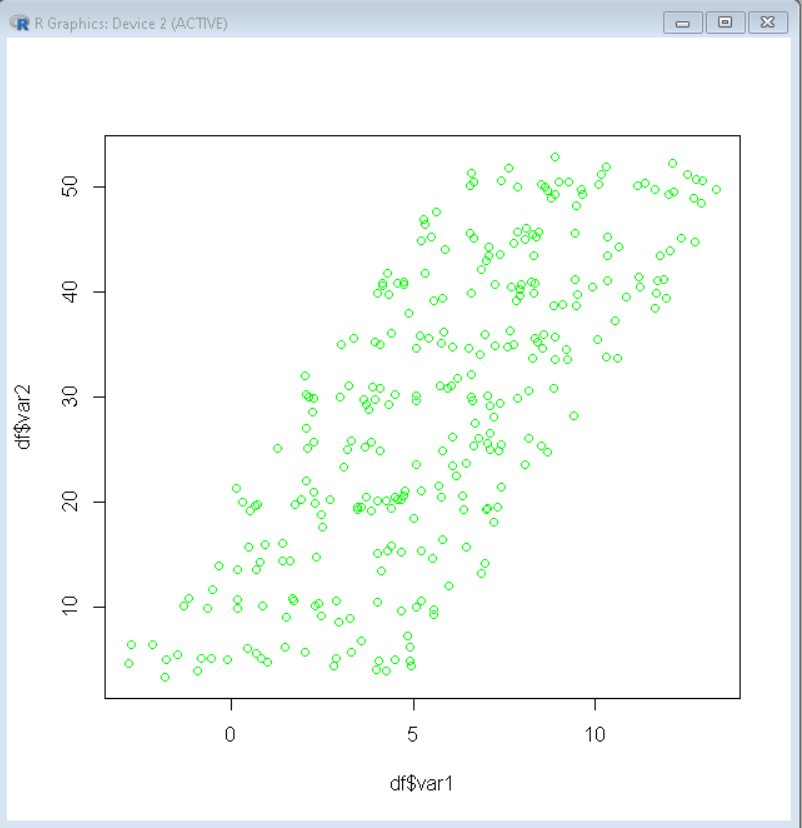
The amount of noise that is added to the data frame also plays a very important role in the visualization. If we add a very large amount of noise to the dataset it affects the integrity of the dataset itself. The addition of noise using the jitter() function is only useful for visualization purposes. Adding noise otherwise will affect the statistical calculation and make the dataset unreliable.
Example: In this example, we have added a very large amount of noise and thus it has made the plot very random and useless
R
df <- read.csv("Sample_data.CSV")
df$var1 <- jitter(df$var1, 20)
plot( df$var1, df$var2, col = 'green')
|
Output:
Share your thoughts in the comments
Please Login to comment...