How to use superscript with ggplot2 in R?
Last Updated :
17 Jun, 2021
In this article, we will see how to use superscript with ggplot2 in the R programming language. You can use Superscript anywhere in the plot where you want. The function will remain the same to use superscript values at all places. Here we will use superscript value at ggplot2 title and at the Label of Axis.
For that, the first ggplot2 package is loaded using the library() function.
Data in Use:
| |
X |
Y |
| 1 |
1 |
1 |
| 2 |
2 |
4 |
| 3 |
3 |
9 |
| 4 |
4 |
16 |
| 5 |
5 |
25 |
| 6 |
6 |
36 |
| 7 |
7 |
49 |
| 8 |
8 |
64 |
| 9 |
9 |
81 |
| 10 |
10 |
100 |
To create an R plot, we use ggplot() function and to make a line graph, add geom_line() function to ggplot() function. Let us first plot it regularly so that the difference is apparent.
Example:
R
library("ggplot2")
DF <- data.frame(X = c(1, 2, 3, 4, 5, 6, 7,
8, 9, 10),
Y = c(1, 4, 9, 16, 25, 36,
49, 64, 81, 100))
ggplot(DF,aes(X, Y))+
geom_line(size = 2, color = "green")
|
Output:
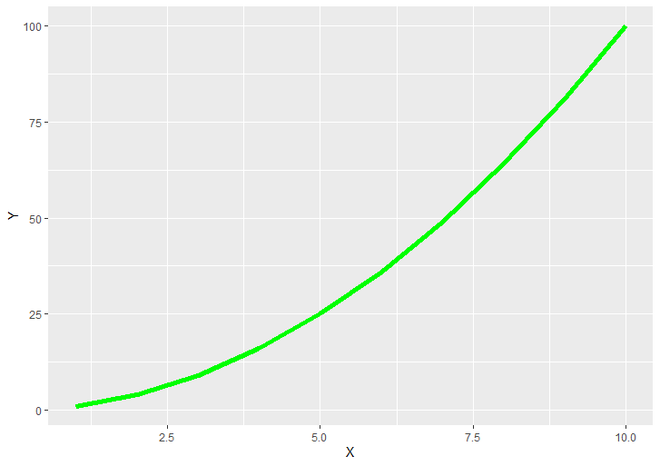
Simple Line Graph
Superscript the Label of Plot Axis
Here bquote() function is uses to produce a superscript label.
Syntax : bquote(expr)
Parameter :
bquote() For SuperScript :
bquote(‘string'(math superscript Notation))
For assigning the labels to X and Y axis, we will use xlab() and ylab() function to give labels to X and Y Axis respectively.
Syntax : xlab(“Label for X-Axis”)
Syntax : ylab(“Label for Y-Axis”)
Example:
R
library("ggplot2")
DF <- data.frame(X = c(1, 2, 3, 4, 5, 6,
7, 8, 9, 10),
Y = c(1, 4, 9, 16, 25, 36,
49, 64, 81, 100))
ggplot(DF,aes(X, Y))+
geom_line(size = 2, color = "green")+
xlab('X-axis (number)')+
ylab(bquote('Y-axis '(number^2)))
|
Output:
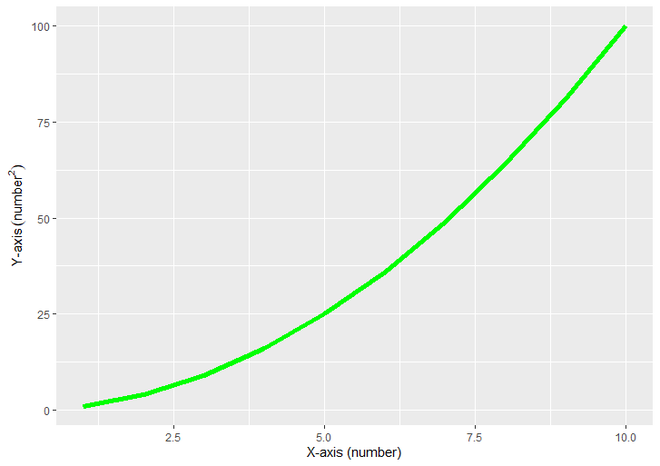
ggplot2 plot with superscripted label of Y Axis
Superscript the Plot Title
To add superscript as a title add bquote function with value inside ggtitle().
Syntax : ggtitle(“Title for Plot”)
Parameter :
- like xlab and ylab functions, we can give the title for plot directly using this function. Here we will bquote() function for writing Superscript value ( Number VS Number2 ) as a title of plot.
Return : Title to plot.
Example:
R
library("ggplot2")
DF <- data.frame(X = c(1, 2, 3, 4, 5, 6,
7, 8, 9, 10),
Y = c(1, 4, 9, 16, 25, 36,
49, 64, 81, 100))
ggplot(DF,aes(X, Y))+
geom_line(size = 2, color = "green")+
ggtitle(bquote('Number VS'~Number^2))
|
Output:
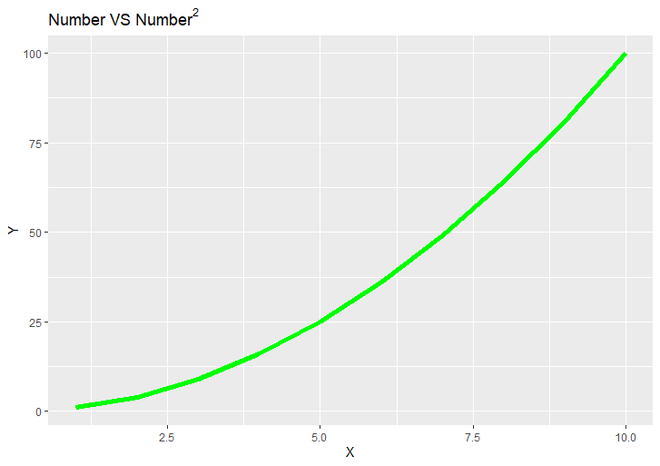
ggplot2 plot with superscripted Title
Like Article
Suggest improvement
Share your thoughts in the comments
Please Login to comment...