How to Use Memory Heap Dumps Data in Android?
Last Updated :
08 Jun, 2022
When we design an Android application, the most prevalent concern among developers is the program’s memory utilization. This is because, the majority of people use low-memory devices, if your program uses a lot of memory, you can lose users. The developers are attempting to locate each and every memory leak in the application in order to optimize it to be leaner and faster. It’s also easier to eliminate memory leaks in your program if you know which objects are utilizing memory at any one time.
What is Profiler?
Profiler is a feature in Android Studio that displays information about our application’s CPU, memory, network, and energy utilization. This is a graphical representation of our application’s CPU, memory, network, and energy utilization. We can optimize our code with the help of this information. But, of these four, CPU, memory, network, and energy, Memory Profiler is the one that every developer uses the most. So, let’s have a look at what Memory Profiler is, and then we’ll learn about the causes of memory leaks and try to find them using Memory Profiler.
The Problem Memory Profiler aids in the detection of memory leaks and churn.
A memory leak occurs when an object becomes unreachable to the running application yet continues to occupy memory.
However, in Java or Kotlin, we have a concept known as Garbage Collection. When your app’s garbage collector detects that some items are no longer in use, it returns the unused memory to the heap. The JVM will first identify the Garbage Collection Root (GC Root), which is an object that may be accessed from outside the heap, such as a running thread or local variables. Then all of the objects that can be accessed from the Garbage Collection Root are recognized and saved. Finally, any things that are not accessible from the Rubbish Collection Root are considered garbage and recycled.

#Image 1 – JVM Memory Model
Memory Leaks occur when an object is not yet destroyed but you are not in a position to use it. As a result, your object will store the memory and you will be unable to access it.
In other words, memory leaks occur as a result of abandoned items that will never be used in the program but are still available.
The Alternative
We may utilize the memory profiler to discover memory leaks in our program. Follow the steps below to open the memory profiler in our application:
- Select View > Tool Window > Profiler from the menu bar.
- On the target device, run your program.
- The graph depicts CPU, memory, network, and energy utilization. Memory Profiler can be launched by clicking anywhere on the memory timeline. The following window will appear:
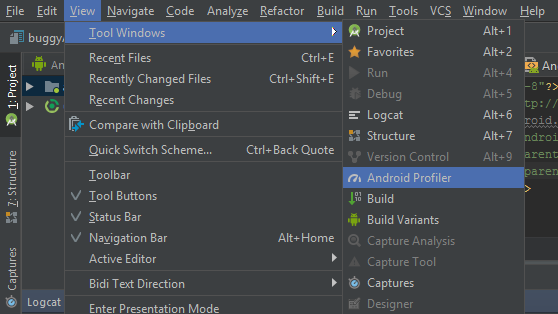
Image #1: Opening the Android Studio Memory Profiler
You can avoid memory leaks for two types of objects, Activity, and Fragment, from here. These are a source of concern because they frequently consume a large amount of memory. The nicest part is that memory leaks of activities and fragments are detected automatically by Memory Profiler starting with Android Studio version 3.6 or higher. Because the behavior of these two classes is clearly specified. So, how does a profiler know if these classes are leaking? There is a leak if an Activity has been terminated but is still referenced.
If there is no FragmentManager associated with a Fragment and it is still referenced, it is a case of a leak. So, the first step in identifying a leak caused by some operations or pieces is to record the heap dump. Let’s have a look at how:
Dump Memory Heap
A heap dump is used to determine which object in our app is consuming memory at the time the heap dump is taken. A heap dump can assist in the detection of memory leaks by displaying objects that are still in memory but will not be used by the program. You can retrieve the following information by capturing the heap dump:
Each thing has its own memory.
- Each object in the code is represented by a reference.
- Our software allocates a specific type of object.
- The location on the call stack where an object was allocated.
In the Memory Profiler, you have one option called “Dump Java heap” for capturing a heap dump. Select it by clicking on it.
We have a lot of information. There are four classes that we can choose from.
They are as follows:
- Allocations: The number of allocations or instances in the heap is displayed here.
- This object type’s native size (in bytes) represents the total amount of native memory it uses (only visible for Android 7.0 or higher).
- Shallow Size: This is the amount of memory (in bytes) that the object consumes.
- Retained Size: This is the amount of memory (in bytes) used by all instances of this class.

Image #2: Checking the Heap Dump
As a result, you can use this information to choose which lessons are worth paying attention to. The Memory Profiler will open an Instance View if you click on any of the class names, which will reveal a list of all the instances of that class. One new piece of information, the depth, can be found here. From any Garbage Collection Root to the specified instance, the depth is the shortest number of hops. The closer an item is to the Garbage Collection Root, the more pathways from the GC Root there are to this object, and the less likely it is to be garbage collected.
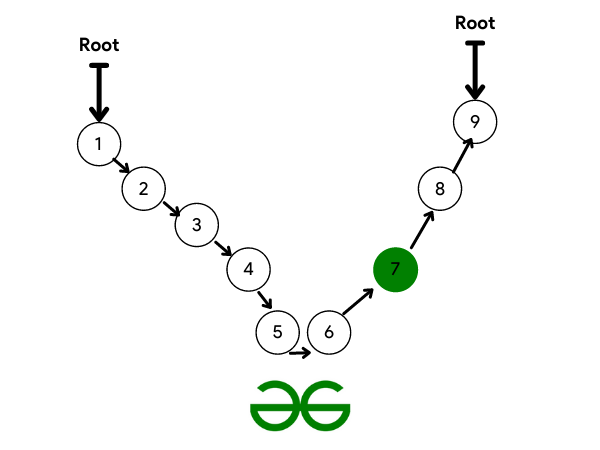
Image #3: The garbage collection process.
If any of the references to the left in the previous example are broken, the 6th node will become unreachable and will be garbage collected. If you want garbage collection on the green node, however, you must break the path from both the left and right sides.
Example
When utilizing any listener, we must always unregister the listener when it is not in use, since if we do not, the listener will remain in the GC Root and will never be garbage collected. As a result, wherever possible, try to unregister the listener in the onPause(), onStop(), or onDestroy() methods. An example of a LocationListener is as follows:
Java
public class GeeksforGeeksAndroid
extends Activity implements doCourse {
@Override
public void onCourseAdded(Location course)
{
}
@Override public void onStart()
{
LocationListener.get().register(this);
}
@Override public void onStop()
{
LocationListener.get().unregister(this);
}
}
|
Conclusion
If you don’t unregister the listener, you’ll get status in the dump java heap that says there’s a memory leak caused by the LocationListener. That’s how you may discover leaks using data from the Memory Profiler’s heap dump, then optimize and repair the code for better results.
Like Article
Suggest improvement
Share your thoughts in the comments
Please Login to comment...