How to use Greek symbols in ggplot2?
Last Updated :
06 Jun, 2021
In this article, we will be looking at the approach to use Greeks symbols in ggplot2 using some in-built functions in the R programming language.
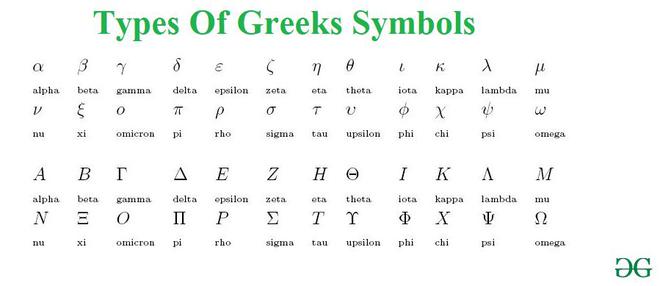
Greeks Symbols are used in mathematics, science, engineering, and other areas where the mathematical notation is used as symbols for constants, special functions, and also conventionally for variables representing certain quantities. In these contexts, the capital letters and the small letters represent distinct and unrelated entities.
Adding Greek symbols to Plot Title
In this method to use Greeks symbols in ggplot2 user need to call the expression function which is a base function of the R programming language, and pass the name of the Greek symbols to be used as the parameters to this function to get a Greek symbol to the ggplot2.
expression() function in R Language is used to create an expression from the values passed as an argument. It creates an object of the expression class.
Syntax:
expression(character)
Parameter:
- character: Expression, like calls, symbols, constants
Example:
R
library("ggplot2")
gfg_data<-data.frame(x=c(1,2,3,4,5),y=c(5,4,3,2,1))
gfg_plot<-ggplot(data=gfg_data, aes(x, y)) +
geom_bar(stat="identity")
gfg_plot + ggtitle(expression(~ alpha * beta*gamma*delta*zeta*tau*phi*xi))
|
Output:
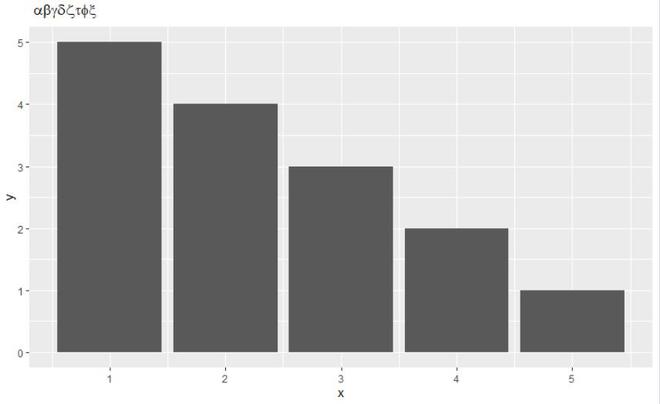
Adding Greek Symbols to the plot
The approach is the same as above, here also expression() method is used but to add symbols to the main plot annotate() function is used.
Syntax: annotate()
Parameters:
- geom : specify text
- x : x axis location
- y : y axis location
- label : custom textual content
- color : color of textual content
- size : size of text
- fontface : fontface of text
- angle : angle of text
Example:
R
library("ggplot2")
gfg_data<-data.frame(x=c(1,2,3,4,5),y=c(5,4,3,2,1))
gfg_plot<-ggplot(data=gfg_data, aes(x, y)) +
geom_bar(stat="identity")
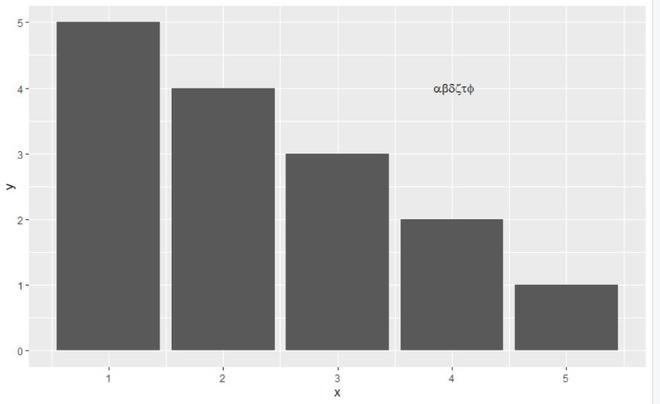
gfg_plot + annotate("text", x = 4, y = 4,
label = expression(
~ alpha * beta*delta*zeta*tau*phi))
|
Output:
Like Article
Suggest improvement
Share your thoughts in the comments
Please Login to comment...