How to Use Glances to Monitor Remote Linux in Web Server Mode?
Last Updated :
11 May, 2021
Glances is a system monitoring tool for Linux machines, it is used to monitor system resources in web server mode or through the web browser. It is an alternative to top and htop monitoring tools. This tool has various features and also provides bits of information on a single screen. Glances is a cross-platform, free and open-source tool for monitoring system resources of Linux machines.
This is run in three modes:
- Standalone Mode: Monitoring single system and results are displayed on the terminal.
- Client/Server Mode: Monitoring multiple systems
- Web-server Mode: Monitoring single system and results displayed in Web Browser/Web Interface
Features of Glances:
- Average CPU Load
- Sleeping processes
- Monitoring 15+ metrics on the system
- Highly configurable and adaptable
- Supports exporting data to different services and databases
- System Info and Uptime
Installation
Repositories are available for Glances in Linux Distributions, execute the following commands depending on your system distribution.
Using packages:
$ sudo apt install glances                  # On Debian system
$ sudo yum install glances                  # On RedHat system
Using Curl:
$ curl -L https://bit.ly/glances | /bin/bash
Using Snap Package:
$ sudo snap install glances
Using wget:
$ wget -O- http://bit.ly/glances | /bin/bash
Glances usage
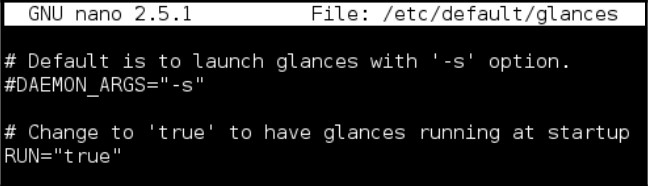
Now after the installation is complete we can edit the file in the directory /etc/default/glances and modify the value of RUN to true
To refresh value in Glances the default time intervals is 1 second, we can manually change the value using -t option followed by time in seconds
$ glances -t 5
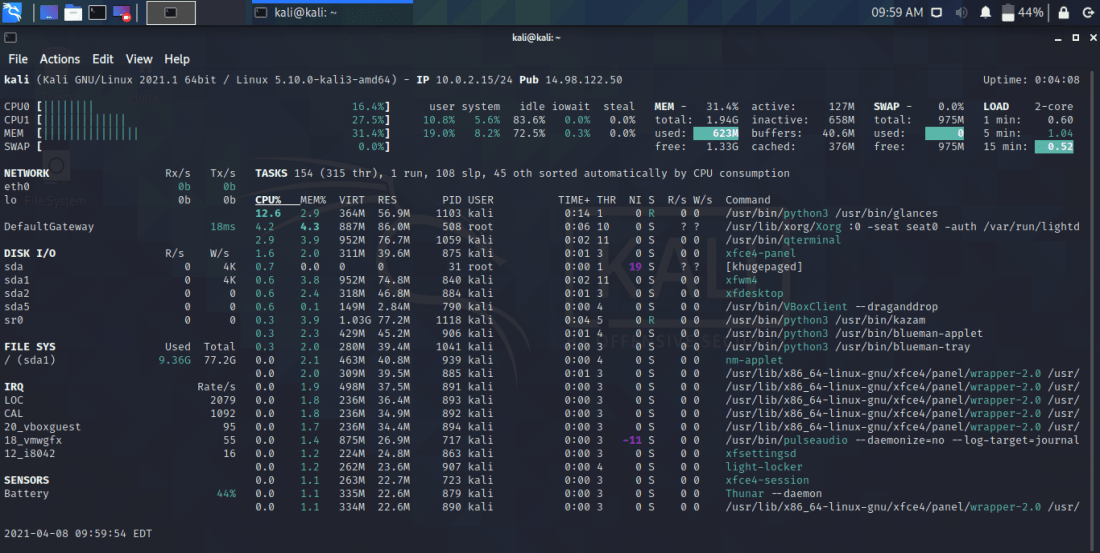
For manually starting the tool, you can execute the command glances to use the tool and monitor the system resources. The glances show different color codes and have different meanings which are as follows,
- Green: Everything is FINE
- Blue: Color depicts CAREFUL, attention is required
- Violet: This means WARNING
- Red: This means it is CRITICAL
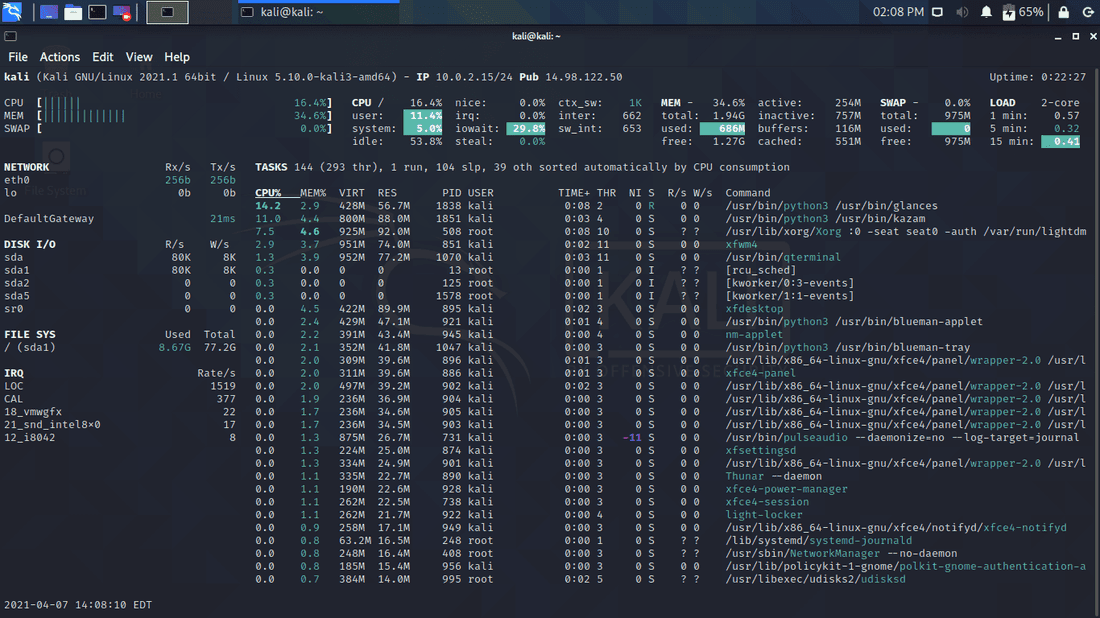
Here we see that the glances tool displays information about the system and also includes a sidebar that contains information on Docker container network I/O, press “2” to open the sidebar.
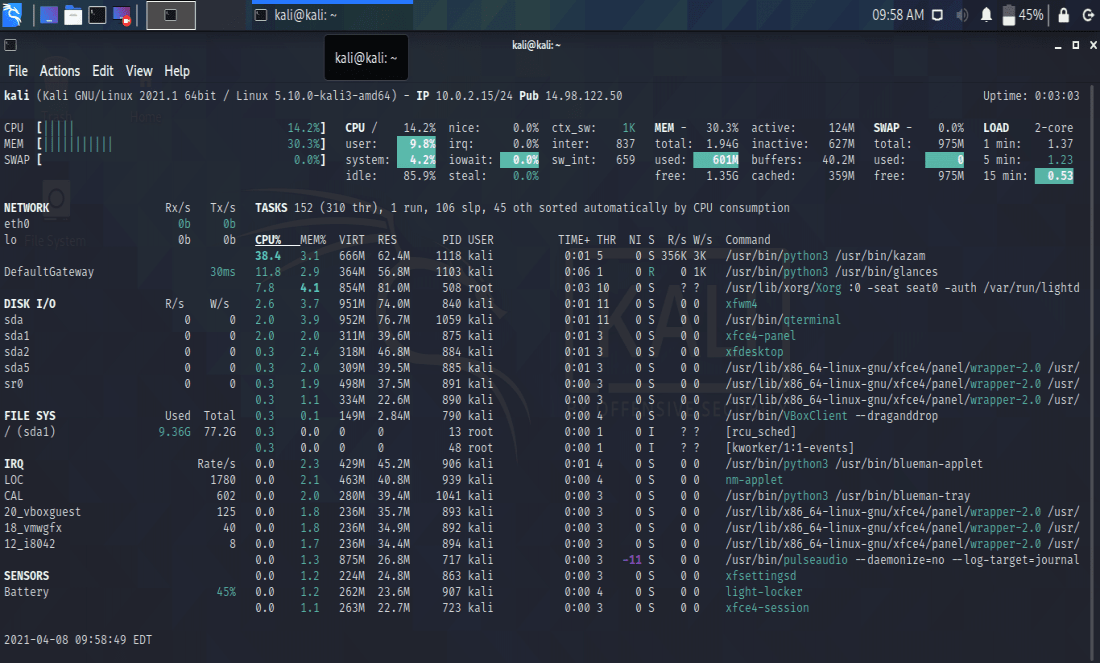
To interact more with Glances while the tool is running press “s” to view sensors on-screen.
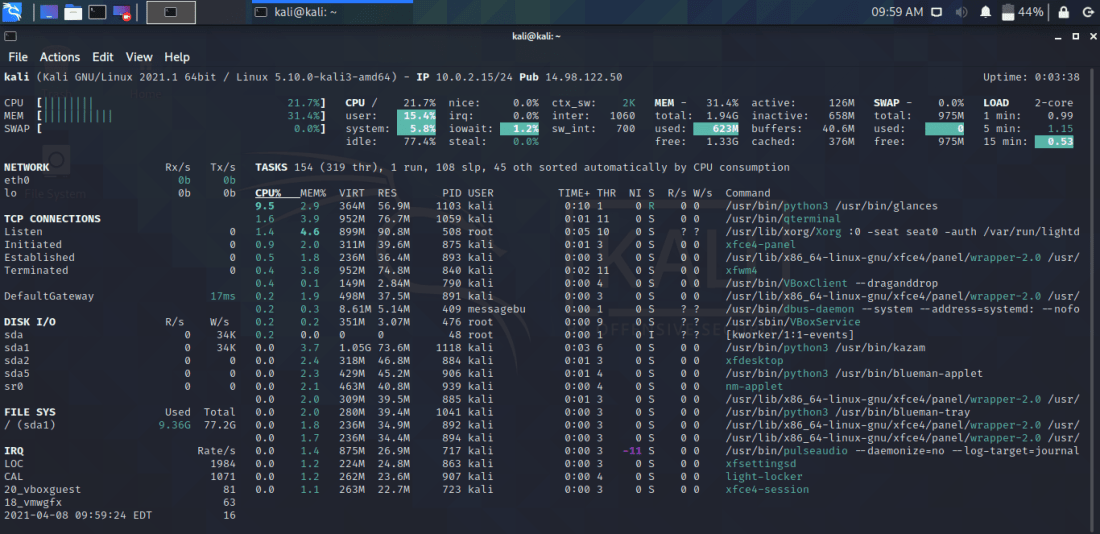
Press “k” to display TCP connections:
Now press “1” to display CPU Stats to show individual threads:
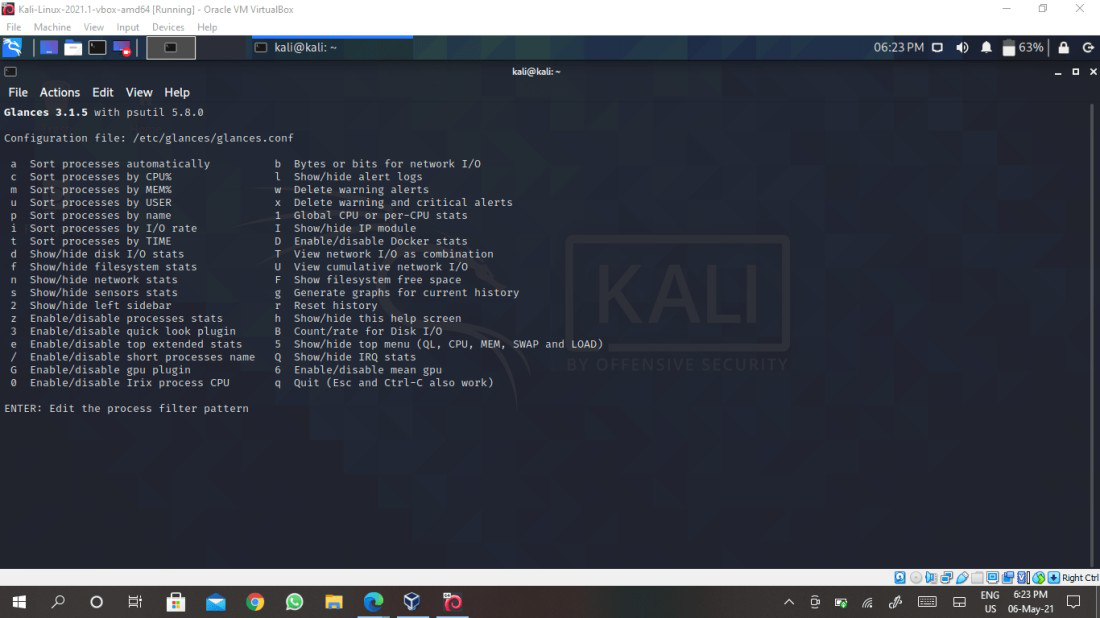
There are various commands in Glances to get an overview of important commands type/press h to invoke the help screen. It will then display a list of useful commands.
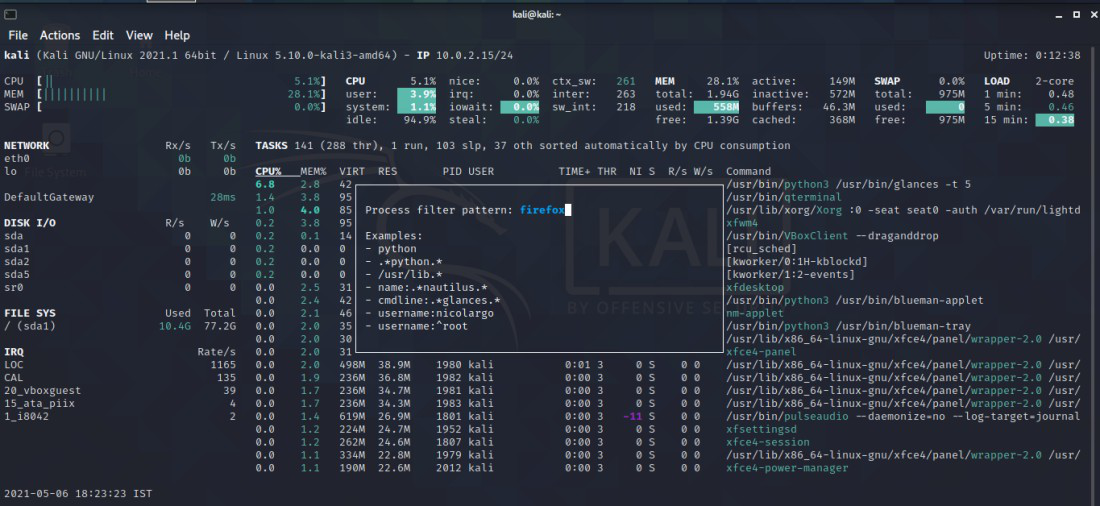
For searching/filtering processes press Enter key, it will show the dialog box for filtering a particular process, where you can type the process name. Specify other parameters for better filtering such as username, password. For a root user, you can enter a username: root and hit enter to filter process and to check for more details press e.
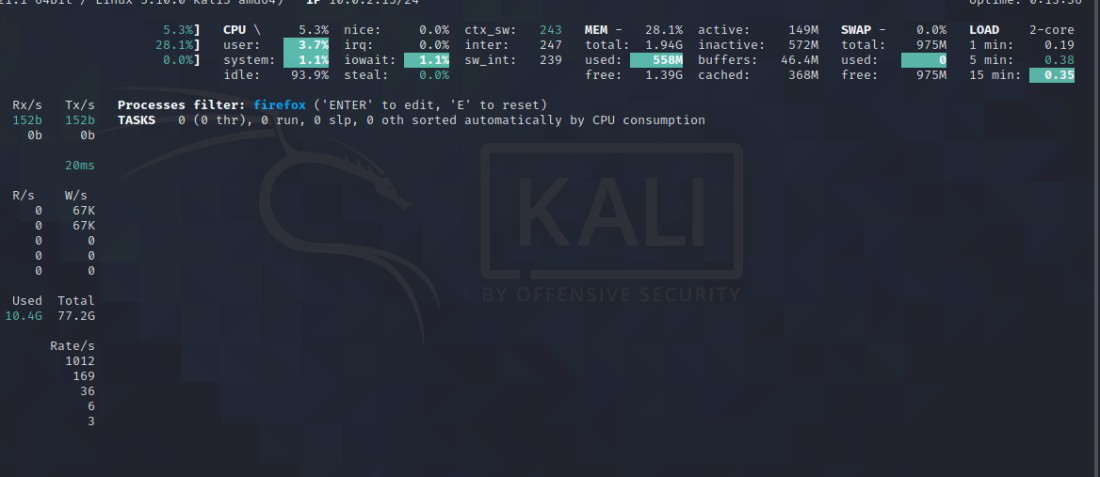
The output for the above process is shown below, to exit press E:
Web Server Mode
To start glances in web server mode, execute the command glances followed by “-w”
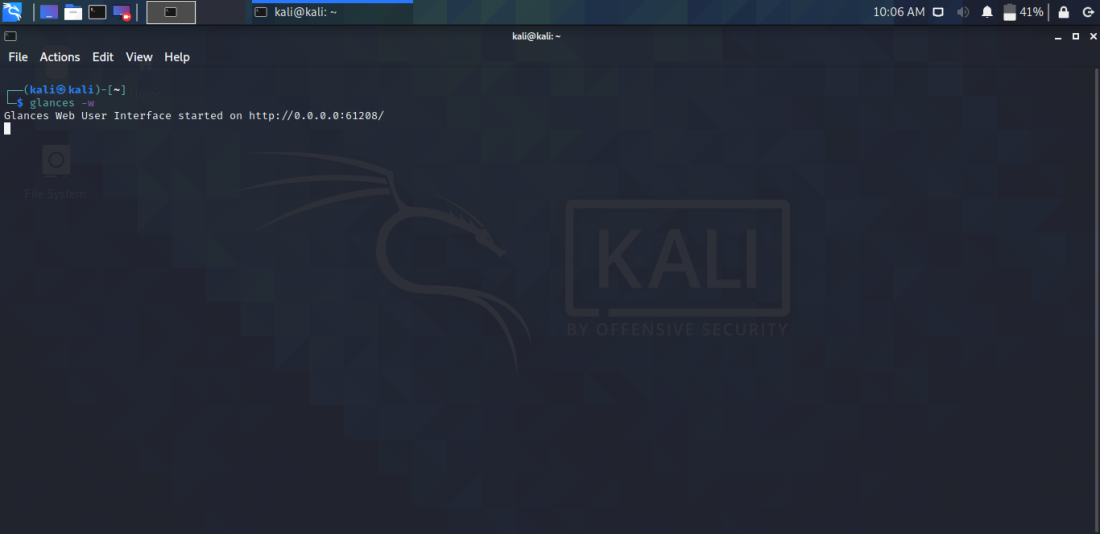
The output shows that the server has started and points to a web browser http://0.0.0.0:61208/ or https://localhost:61208/. (0.0.0.0 – Server IP Address of host). Web Interface displays the information we saw in the glances tool as well, but the difference here is it opens in the browser window. For terminating web server navigate to the terminal where the command runs and press Ctrl + C.
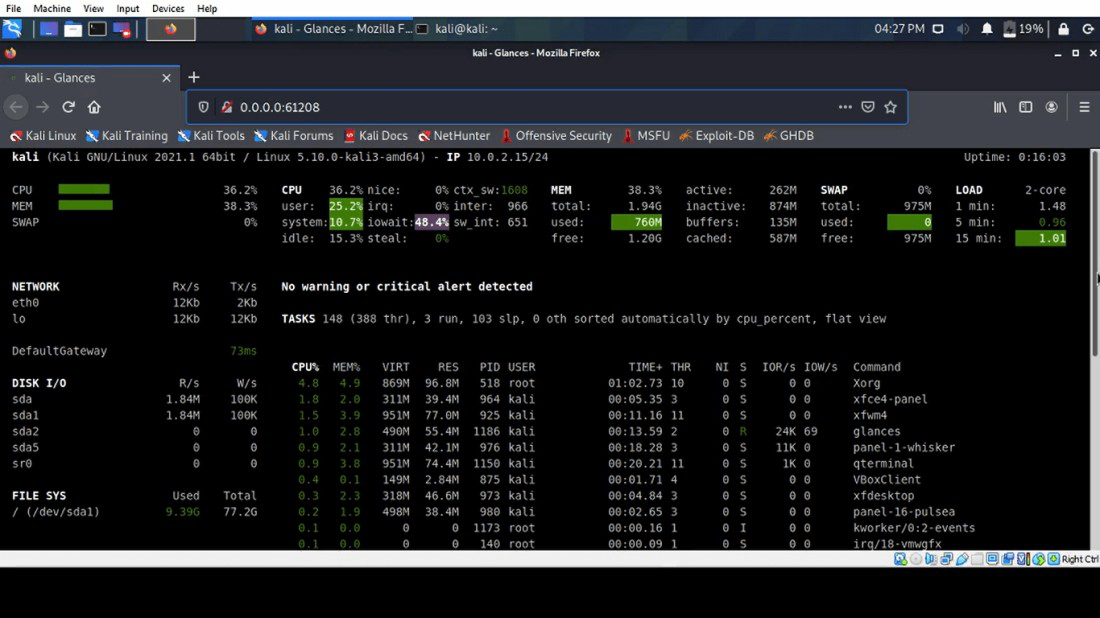
Glances in Web-Server Mode
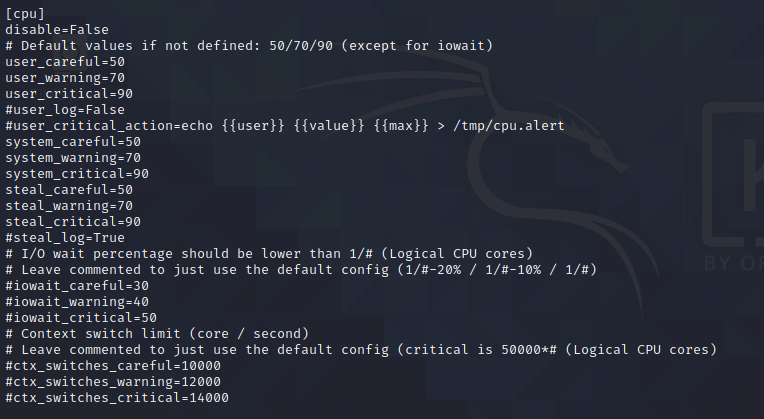
Configuring Glances
Glances configure behavior through glances.conf configuration file. For triggering warnings at your own values then default values it is explicitly stated in the configuration file. To specify some custom alert values for CPU Usage, then specify values in the CPU section. It is also possible to change the preferences and modify them like memory, I/O, network in the configuration file.
Like Article
Suggest improvement
Share your thoughts in the comments
Please Login to comment...