The Android Profiler replaces the Android Monitor features in Android Studio 3.0 and higher. The Android Profiler tools give you real-time information on how your app consumes CPU, memory, network, and battery resources. Select View > Tool Windows > Profiler from the menu bar.
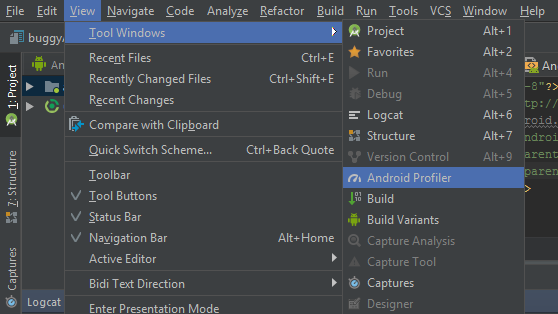
Figure 0. Navigating to the Android Profiler
OR click Profile in the toolbar to bring up the Profiler window. Choose the device on which to profile your program if prompted by the Select Deployment Target window. If a device isn’t shown after you’ve connected it through USB, make sure USB debugging is turned on. The Android Profiler lists all running processes, even if they aren’t debuggable if you’re using the Android Emulator or a rooted device. That process is picked by default when you begin a debuggable program. Until you unplug the device or choose End Session, Android Profiler continues to gather profiling data.
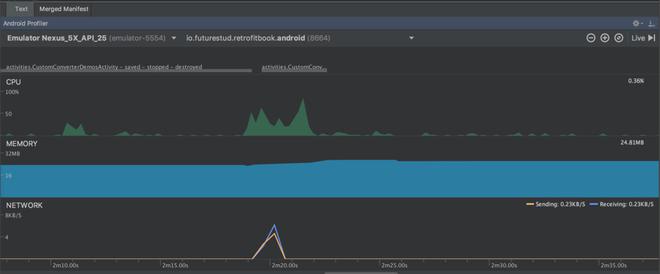
Figure 1. CPU Analysis using Memory Profiler
- Android Profiler displays the currently profiled process and device.
- Select a session to view in the Sessions window, or start a new profiling session.
- Click the zoom buttons to choose how much of the timeline you want to see, or use the Attach to live button to get straight to the live updates.
- The user input timeline displays events like keyboard activity, volume control adjustments, and screen rotations.
- The shared timeline view, which shows graphs for CPU, memory, network, and energy use.
Android Memory Management
Each memory allocation in the heap is tracked by the Android virtual machine. The heap is a section of memory where Java/Kotlin objects are allocated by the system. Garbage collection is the procedure for recovering unused memory. Its aims are as follows:
- Look for items that no one needs.
- Return the memory utilized by those objects to the heap by reclaiming it.
Garbage collection isn’t something you usually request. Instead, the system uses a set of criteria to determine when one should be performed. Android places a restriction on the heap size for each program to allow for multitasking. The size of this file will vary based on the amount of RAM available on the device. You can get an OutOfMemoryError Exception when the heap capacity is full and the system tries to allocate extra memory.
Roots of Garbage Collection
Assume you have the following items in your memory head:
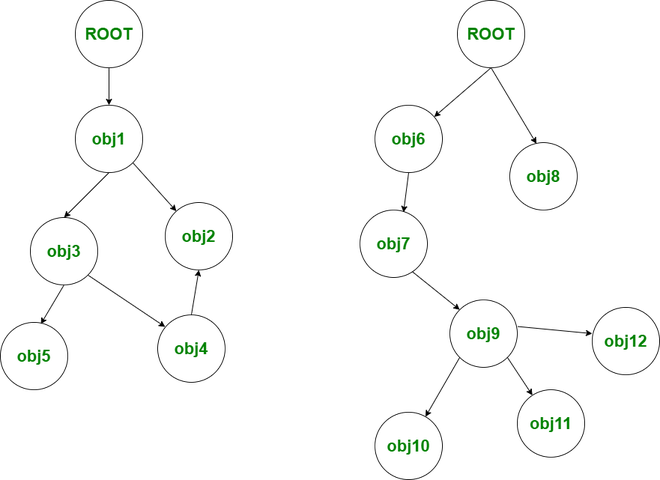
Figure 2. Head of the memory
GC Roots are the white items at the top of the screen. They are not referenced by any other item in the heap. To make things easier, consider obj9 as an activity that retains the following objects: obj10, obj11, and obj12. Assume you’re engaged in that activity and push return to complete it. The system will change the obj7 to obj9 reference. When the Garbage Collector is triggered by the system, it will begin at the GC roots. It will recognize that obj9 and the other objects it has stored, obj10, obj11, and obj12, are not accessible and will collect them.
What Are the Benefits of Profiling Your App Memory?
To let the Garbage Collector do its task, the system must halt your app’s code. This procedure is usually undetectable. However, you may find that your app is slow and skips frames at other times. When your software allocates memory quicker than the system can gather it, you’ll see this error. Memory that has been leaked cannot be returned to the heap. This causes unnecessary garbage collection events to occur, slowing down the system as a result. In order to reclaim the memory, the system may eventually kill your app process. You should profile your app’s RAM and another memory usage to prevent these issues.
When it comes to memory, there are a few different ways to go about measuring it.
According to the Android system, the numbers you see at the top of the Memory Profiler are based on all of the private memory pages that your program has committed. This figure excludes pages shared with the operating system or other programs.
The memory count is broken down into the following categories:
- Java: Memory from Java or Kotlin code-allocated objects.
- Memory allocated by C or C++ code is referred to as native memory. Even if your app doesn’t utilize C++, native memory could be needed here because the Android framework uses native memory to do different duties on your behalfs, such as processing picture assets and other graphics—even if your code is written in Java or Kotlin.
- Graphics memory is used for graphics buffer queues that show pixels on the screen, such as GL surfaces and GL textures. (Note that this is shared memory with the CPU rather than specialized GPU memory.)
- Stack: Your app’s native and Java stacks both consume this memory. This typically has something to do with the number of threads your software is using.
- Code: Memory allocated to your app’s code and resources, such as dex bytecode, optimized or compiled dex code,.so libraries, and fonts.
- Others: Memory that your software uses that the system isn’t sure how to classify.
Your program has allocated a certain amount of Java/Kotlin objects. Objects allocated in C and C++ are not included. This allocation count starts only when the Memory Profiler connects to your running app when linked to a device running Android 7.1 or below. As a result, all objects allocated prior to the start of profiling are unaccounted for. On Android 8.0 and above, however, an on-device profiling tool maintains track of all allocations, so this figure always represents the entire number of Java objects outstanding in your app.
When compared to the previous Android Monitor tool’s memory counts, the new Memory Profiler captures your memory in a different way, thus it may appear that your memory usage has increased. The Memory Profiler monitors various more categories that add to the total, but if you simply care about the Java heap memory, the “Java” figure should be identical to the prior tool’s result. The new number accounts for all physical memory pages that have been allocated to your app’s Java heap since it was forked from Zygote, even if it doesn’t exactly match what you observed in Android Monitor. As a result, you’ll be able to see exactly how much physical memory your program is utilizing.
Looking at the Memory Allocations
Memory allocations explain how each Java object and JNI reference was allocated in your memory. The Memory Profiler may display you the following information regarding object allocations:
What kinds of things were given out, and how much room did they take up?
Each allocation’s stack trace, including the thread it occurred in.
When the items were re-assigned (only when using a device with Android 8.0 or higher).
You may examine your object allocations at any moment if your device is running Android 8.0 or higher: Select the region for which you wish to see the allocations by dragging on the timeline (as shown in video 1). There’s no need to start a recording session because Android 8.0 and above comes with an on-device profiling tool that monitors your app’s allocations in real-time.
Follow these Procedures to Check the Allocation Record
Look through the list for items with extremely high heap counts that might be leaked. To make it easier to discover known classes, sort alphabetically by clicking the Class Name column header. Then select a class from the drop-down menu. As seen in figure 3, the Instance View pane displays on the right, displaying each instance of that class.
Alternatively, you may rapidly locate items by pressing Control+F (Command+F on Mac) and typing a class or package name into the search area, or by choosing Filter. If you choose to Arrange by callstack from the dropdown menu, you may also search by method name. Check the box next to Regex if you wish to utilize regular expressions. If your search phrase is case-sensitive, check the box next to Match case. Select an instance in the Instance View window. The Call Stack tab displays below, indicating where and in which thread that instance was allocated. Right-click any line in the Call Stack tab and select Jump to Source to open that code in the editor.
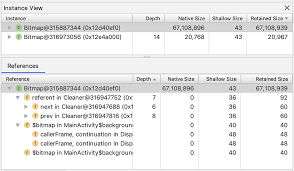
Figure 3. Checking Allocation Record
Improve the Performance of Your app While Profiling it
The memory profiler samples memory allocations frequently by default to optimize app performance during profiling. The Allocation Tracking option may be used to adjust this behavior when testing on devices running API level 26 or above. The following are the alternatives available:
- Full: Captures all memory allocations for all objects. In Android Studio 3.2 and prior, this was the default behavior. If your software allocates a large number of objects, you may see obvious slowdowns while profiling it.
- Object: allocations in memory are sampled at regular intervals. This is the default setting, and it has a minimal influence on app performance when profiling. Apps that allocate a large number of objects in a short period of time may still experience noticeable lag.
- Off: Disables memory tracking for your app.
GeekTip: When doing a CPU recording, Android Studio disables live allocation tracking by default and re-enables it when the recording is completed. In the CPU recording setting dialogue, you can adjust this behavior.
Snapping the Garbage
A heap dump reveals which objects in your program are consuming memory at the time the heap dump is taken. A heap dump can assist uncover memory leaks by revealing things lingering in memory that you suspect should not be there, especially after a prolonged user session. You can see the following after capturing a heap dump:
- What kind of objects have been assigned to your app, and how many of each have been assigned.
- How much memory is used by each item?
- Where do you save references to each object in your code?
- The location on the call stack where an object was allocated. (Call stacks are presently available with a heap dump only if you capture the heap dump while recording allocations with Android 7.1 and below.)
In the Memory Profiler toolbar, click Dump Java heap to capture a heap dump. The amount of Java memory used while emptying the heap may briefly rise. This is typical since the heap dump happens in the same process as your program and collects data from memory.
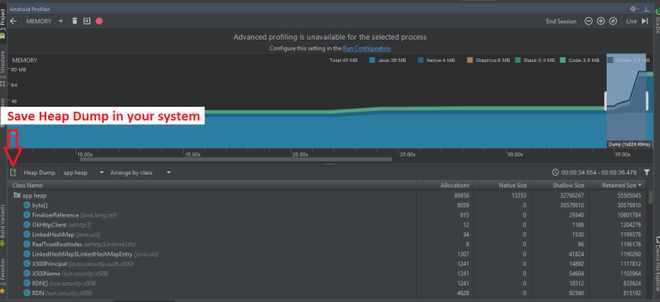
Figure 4. Snapping Heap
To Check Your Heap, go Through the Following Steps
Look through the list to see if there are any objects with unusually high heap counts that may have been leaked. Click the Class Name column header to sort alphabetically, which will aid in the discovery of recognized classes. After that, select a class from the drop-down menu. As seen in figure 6, the Instance View pane displays on the right, displaying each instance of that class.
Alternatively, you may rapidly locate items by pressing Control+F (Command+F on Mac) and typing a class or package name into the search area, or by choosing Filter. Selecting Arrange by callstack from the dropdown menu also allows you to search by method name. Uncheck the box next to Regex if you wish to utilise regular expressions. If your search phrase is case-sensitive, choose the box next to Match case.
Select an instance from the Instance View window. The References tab appears below, and it lists all of the objects that are linked to that item.
Alternatively, click the arrow next to the instance name to see all of the fields it contains, and then click a field name to see all of its references. To display the instance information for a field, right-click on the field and select Go to Instance from the context menu.
If you see a reference in the References tab that appears to be leaking memory, right-click it and select Go to Instance. This chooses the appropriate instance from the heap dump and displays its own instance data. Look for memory leaks caused by any of the following in your heap dump:
- Activity, View, Context, Drawable, and other objects that may have a reference.
- Inner classes that may store an Activity instance but are not static, such as a Runnable.
- Caches that keep things in memory for longer than they should.
GeekTip: The monkeyrunner test framework may also be used to complete the aforementioned stages.
Like Article
Suggest improvement
Share your thoughts in the comments
Please Login to comment...