How to suppress the vertical gridlines using ggplot2 in R?
Last Updated :
28 Jul, 2021
In this article, we will discuss various ways of suppressing vertical gridlines in ggplot using an R programming language.
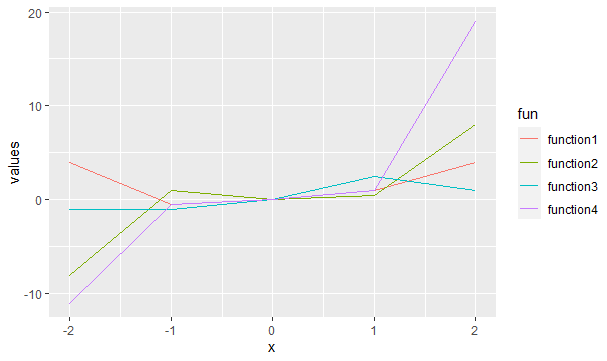
Let’s first draw a regular plot without making any changes, so the difference is traceable:
R
library("ggplot2")
function1<- function(x){x**2}
function2<-function(x){x**3}
function3<-function(x){x/2}
function4<-function(x){2*(x**3)+(x**2)-(x/2)}
df=data.frame(x=-2:2,
values=c(function1(-2:2),
function2(-2:2),
function3(-2:2),
function4(-2:2)),
fun=rep(c("function1","function2",
"function3","function4"))
)
ggplot(df,aes(x,values,col=fun))+geom_line()
|
Output:
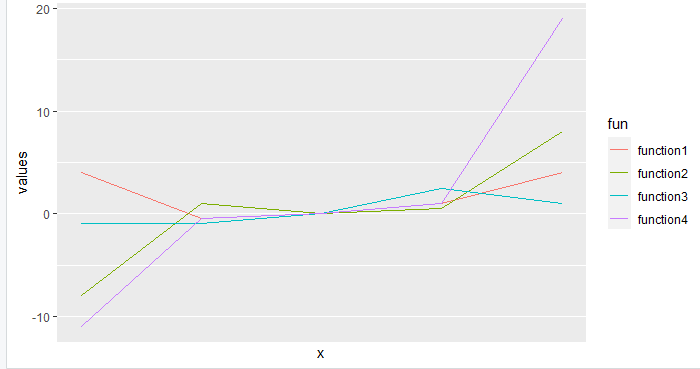
Method 1: Using scale_x_continuous()
scale_x_continuous() function can be used to handle the look and appeal of vertical gridlines. The breaks attribute of this function can be set to NULL, for removing them from the plot.
Syntax: scale_x_continuous(breaks=NULL)
Example: Suppressing the vertical gridlines using scale_x_continuous()
R
library("ggplot2")
function1<- function(x){x**2}
function2<-function(x){x**3}
function3<-function(x){x/2}
function4<-function(x){2*(x**3)+(x**2)-(x/2)}
df=data.frame(x=-2:2,
values=c(function1(-2:2),
function2(-2:2),
function3(-2:2),
function4(-2:2)),
fun=rep(c("function1","function2",
"function3","function4"))
)
ggplot(df,aes(x,values,col=fun))+geom_line()+
scale_x_continuous(breaks=NULL)
|
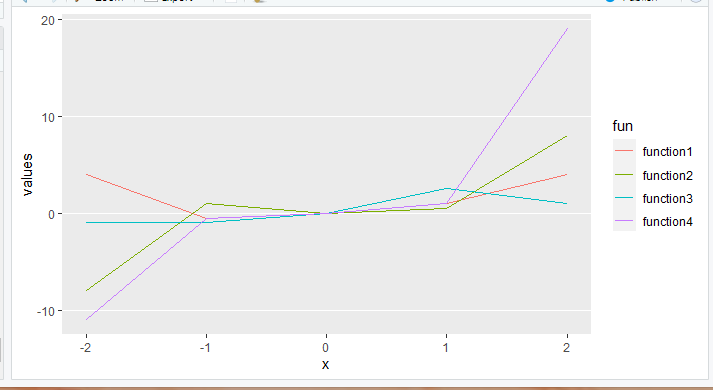
Method 2: Using ggExtra package
This package has a function called removeGrid() which as the name suggests is used to suppress the grid line of the plot.
Syntax: removeGrid(x, y)
Where, y attribute of this function should be set to false in order to suppress vertical gridlines in particular.
Example: Suppressing the vertical gridlines using ggExtra
R
library("ggplot2")
library("ggExtra")
function1<- function(x){x**2}
function2<-function(x){x**3}
function3<-function(x){x/2}
function4<-function(x){2*(x**3)+(x**2)-(x/2)}
df=data.frame(x=-2:2,
values=c(function1(-2:2),
function2(-2:2),
function3(-2:2),
function4(-2:2)),
fun=rep(c("function1","function2",
"function3","function4"))
)
ggplot(df,aes(x,values,col=fun))+geom_line()+
removeGrid(y=FALSE)
|
Output:
Like Article
Suggest improvement
Share your thoughts in the comments
Please Login to comment...