How to standardized a column of R DataFrame ?
Last Updated :
05 Apr, 2021
A large dataset that had multiple columns with varying ranges and units may need to be standardized before further processing. In this article, we will be discussing how to standardize a column of dataframe in R Programming Language.
Let’s first discuss standardization. Standardization is a feature scaling technique. It is the process of rescaling data so that the data have a mean of ‘0’ and standard deviation of ‘1’.
Formula:

Here,  is mean and
  is standard deviation. We are subtracting the mean from each value in observation and then dividing by standard deviation. This is also called the Z-score formula.
Example :
| Name
| Age
| CGPA
|
|---|
1.
| A
| 15
| 5.0
|
|---|
2.
| B
| 16
| 4.0
|
|---|
3.
| C
| 20
| 5.0
|
|---|
4.
| D
| 19
| 2.0
|
|---|
5.
| E
| 19
| 1.0
|
|---|
6.
| F
| 17
| 3.0
|
|---|
In this dataset, we have student names, their age, and CGPA as column names. As age is in the range from 15 to 20 and CGPA is ranging from 1.0 to 5.0. We would like to standardize the CGPA and age column. So, our dataset should look like this:
| Name
| Age
| CGPA
|
|---|
1.
| A
| -1.3561270
| 1.0206207
|
|---|
2.
| B
| -0.8475794
| 0.4082483
|
|---|
3.
| C
| 1.1866111
| 1.0206207
|
|---|
4.
| D
| 0.6780635
| -0.8164966
|
|---|
5.
| E
| 0.6780635
| -1.4288690
|
|---|
6.
| F
| -0.3390318
| -0.2041241
|
|---|
Method 1: Using Scale function.
R has a built-in function called scale() for the purpose of standardization.
Syntax: scale(x,center=True,scale=True)
Here, “x” represents the data column/dataset on which you want to apply standardization. “center” parameter takes boolean values, it will subtract the mean from the observation value when it is set to True. “scale” parameter takes boolean values, it will divide the resulting difference by standard deviation when it is set to True.
Approach:
- Create dataset
- Apply scale function on the data column
- Convert the vector result to the data frame
- Display result
Program:
R
X <- c('A','B','C','D','E','F')
Y <- c(15,16,20,19,19,17)
Z <- c(5.0,4.0,5.0,2.0,1.0,3.0)
dataframe <- data.frame(Name = X, Age = Y, CGPA = Z )
dataframe[2 : 3] <- as.data.frame(scale(dataframe[2 : 3]))
dataframe
|
Output:
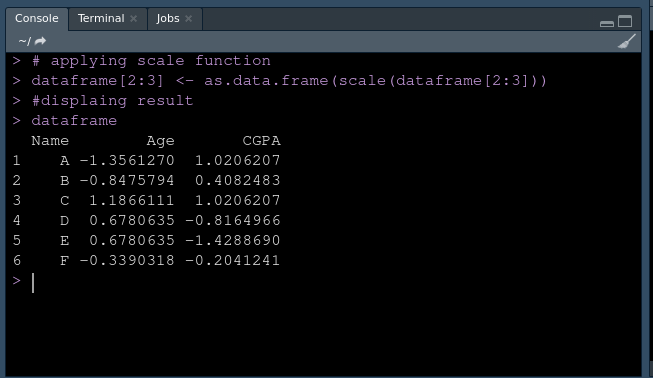
Using Scale
Method 2: Using base R
Approach:
- Create Dataset.
- Create a function for standardization.
Syntax: standardize = function(x){ z <- (x – mean(x)) / sd(x) return( z)}
- Apply this function to the data columns.
- Convert the vector result to the data frame
- Display result
Program:
R
X <- c('A', 'B', 'C', 'D', 'E', 'F')
Y <- c(15, 16, 20, 19, 19, 17)
Z <- c(5.0, 4.0, 5.0, 2.0, 1.0, 3.0)
dataframe <- data.frame(Name = X, Age = Y, CGPA = Z )
standardize = function(x){
z <- (x - mean(x)) / sd(x)
return( z)
}
dataframe[2:3] <-
apply(dataframe[2:3], 2, standardize)
dataframe
|
Output:
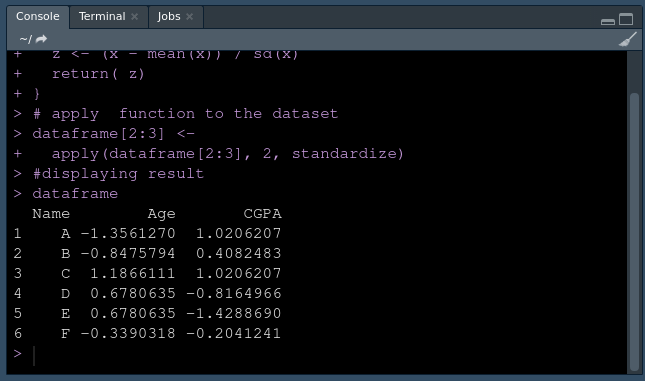
Using Custom standardization function
Like Article
Suggest improvement
Share your thoughts in the comments
Please Login to comment...