How to Show Gridlines on Matplotlib Plots?
Last Updated :
28 Nov, 2021
In this article, we will see how we can add gridlines to a matplotlib graph and various configurable parameters that can be used in Python.
Example:
Create a matplotlib plot using sample data.
Python
import matplotlib.pyplot as plt
X = [12, 34, 23, 45, 67, 89]
Y = [1, 3, 67, 78, 7, 5]
plt.plot(X, Y)
plt.show()
|
Output

grid()
The grid() method is used to define a grid in a matplotlib graph. The syntax is given by –
Syntax:
matplotlib.pyplot.grid(b=None, which=’major’, axis=’both’, **kwargs)
Parameters:
- b: bool or None, optional: Whether to show the grid lines. If any kwargs are supplied, it is assumed you want the grid on and b will be set to True. If b is None and there are no kwargs, this toggles the visibility of the lines.
- which: {‘major’, ‘minor’, ‘both’}, optional: The grid lines to apply the changes on.
- axis: {‘both’, ‘x’, ‘y’}, optional: The axis to apply the changes on.
- **kwargs: Line2D properties: Define the line properties of the grid
Example 1: Default Gridlines
Python
import matplotlib.pyplot as plt
X = [12, 34, 23, 45, 67, 89]
Y = [1, 3, 67, 78, 7, 5]
plt.plot(X, Y)
plt.grid(b=True)
plt.show()
|
Output
Example 2: Apply Gridlines to x- axis
In the cases, where we would want to see only the vertical or horizontal gridlines, we can make use of the `axis` parameter. To view only vertical gridlines –
Syntax:
plt.grid(b=True, axis='x')
Python3
import matplotlib.pyplot as plt
X = [12, 34, 23, 45, 67, 89]
Y = [1, 3, 67, 78, 7, 5]
plt.plot(X, Y)
plt.grid(b=True, axis='x')
plt.show()
|
Output:

Example 3: Apply Gridlines to y-axis
In the cases, where we would want to see only the vertical or horizontal gridlines, we can make use of the `axis` parameter. To view only horizontal gridlines –
Syntax:
plt.grid(b=True, axis='y')
Python3
import matplotlib.pyplot as plt
X = [12, 34, 23, 45, 67, 89]
Y = [1, 3, 67, 78, 7, 5]
plt.plot(X, Y)
plt.grid(b=True, axis='y')
plt.show()
|
Output:

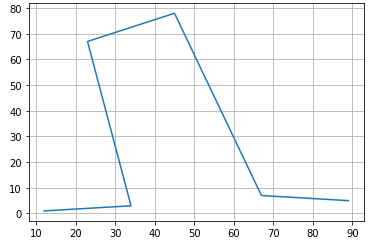
Example 4: Provide a linestyle and linewidth
We have seen the gridlines being a solid lines. We can change this to view a different line-style like dashes using an argument `linestyle` or `ls`. Similarly, we can change the thickness of the gridlines using the argument `linewidth`. These arguments are provided as part of the keyword arguments and can be viewed in the document link.
To provide a line style –
Syntax:
plt.grid(linestyle='--')
Python3
import matplotlib.pyplot as plt
X = [12, 34, 23, 45, 67, 89]
Y = [1, 3, 67, 78, 7, 5]
plt.plot(X, Y)
plt.grid(linestyle='--')
plt.show()
|
Output:

.
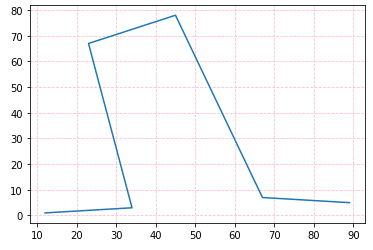
Example 5: Change color of the Gridlines
The keyword argument `color` can be used to define a different color to the plot.
Syntax:
plt.grid(linestyle, color)
Python3
import matplotlib.pyplot as plt
X = [12, 34, 23, 45, 67, 89]
Y = [1, 3, 67, 78, 7, 5]
plt.plot(X, Y)
plt.grid(linestyle='--', color='pink')
plt.show()
|
Output:
Like Article
Suggest improvement
Share your thoughts in the comments
Please Login to comment...