How to shade a graph in R?
Last Updated :
18 Mar, 2022
In this article, we will be looking at the various approaches to shade a graph in the R programming language.
Method 1: Shade a graph using polygon function :
In this method, we are calling the polygon function with its argument col passed with the name or the hex code of the color needed to be shaded in the given graph.
Polygon function:
It is used to plot a polygon between specified points in an existing plot.
Syntax: polygon(x_coordinates, y_coordinates,col)
Parameters :
- x_coordinates, y_coordinates: x, y coordinates of plot to draw polygon
- col: Color to the polygon
Returns: a polygon in a given plotParameters;
Example:
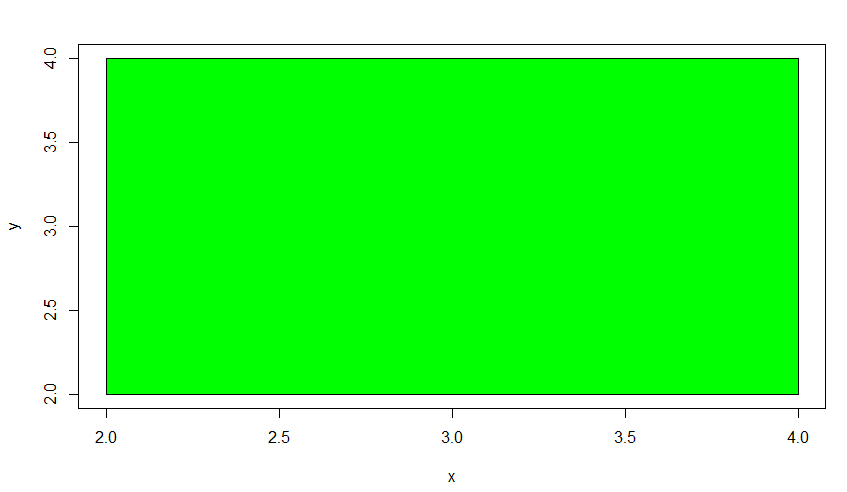
In this example, we will create a random line graph, and then with the use of the polygon function argument col, we will specify the color to green of the created graph.
R
x<-c(2,4,4,2)
y<-c(2,2,4,4)
plot(x, y, type = "l")
polygon(x, y, col = "green")
|
Output:
Method 2: Shade the area between two lines
In this method, we are using the polygon function with the col argument within it and here, the difference is just in the shape of the given graph rest all is similar to the previous method.
Example:
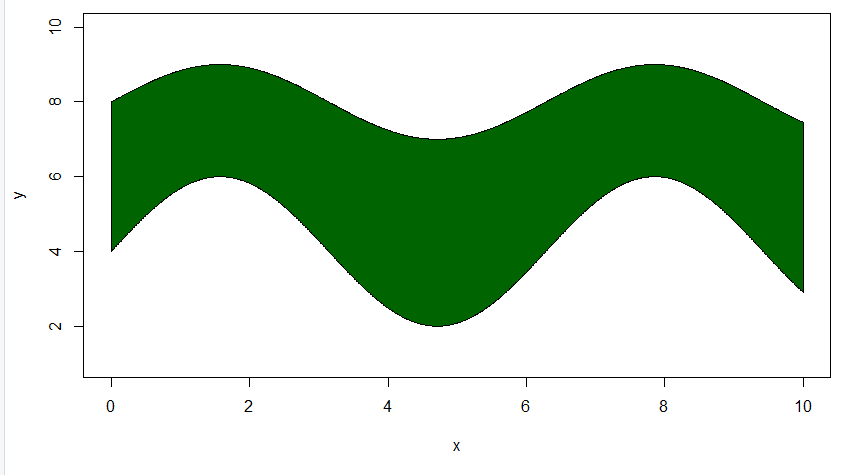
In this example, we will be creating two sin function line graphs and between these line graphs, we will be filling the color to green using the polygon function with the col specified to green as the argument.
R
x <- seq(0, 10, 0.01)
y1 <- sin(x) + 8
y2 <- 2* sin(x) + 4
plot(x, y1, type = "l", ylim = c(1, 10), ylab = "y")
lines(x, y2, col = 2)
polygon(c(x, rev(x)), c(y2, rev(y1)),
col = "darkgreen")
|
Output:
Method 3: Shade the area with shading lines
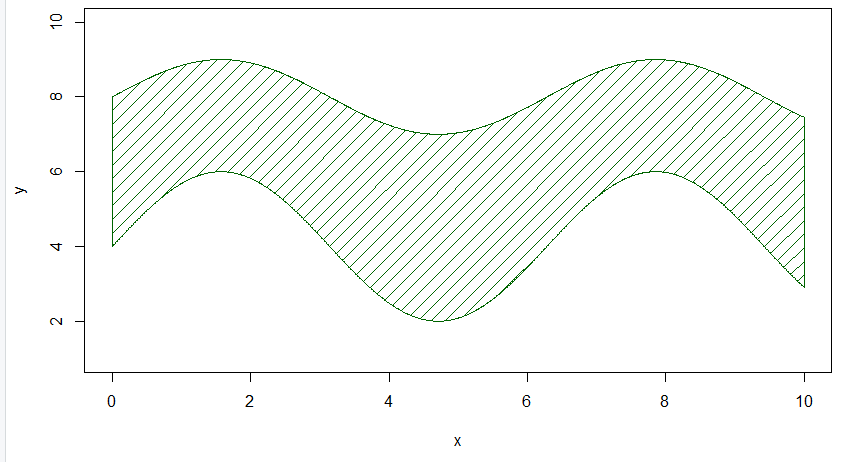
Under this method, we are using the density and the angle argument of the polygon function where the density is responsible for the number of lines per unit area and the angle in the angle at which the line is to be drawn.
Example:
In this example, we are creating a line plot in the shape of t of the rectangle and with the use of the density and angle argument of the polygon function, we are shading a line of green color within the line rectangle plot.
R
x <- seq(0, 10, 0.01)
y1 <- sin(x) + 8
y2 <- 2* sin(x) + 4
plot(x, y1, type = "l", ylim = c(1, 10), ylab = "y")
lines(x, y2, col = 2)
polygon(c(x, rev(x)), c(y2, rev(y1)),
col = "darkgreen",density = 10, angle = 45)
|
Output:
Like Article
Suggest improvement
Share your thoughts in the comments
Please Login to comment...