How to Set Tick Labels Font Size in Matplotlib?
Last Updated :
26 Nov, 2022
Prerequisite: Matplotlib
In this article, we will learn how to change (increase/decrease) the font size of tick label of a plot in matplotlib. For this understanding of following concepts is mandatory:
- Matplotlib : Matplotlib is an amazing visualization library in Python for 2D plots of arrays. Matplotlib is a multi-platform data visualization library built on NumPy arrays and designed to work with the broader SciPy stack. It was introduced by John Hunter in the year 2002.
- Tick Label : Ticks are the markers denoting data points on axes. Matplotlib’s default tick locators and formatters are designed to be generally sufficient in many common situations. Position and labels of ticks are often explicitly mentioned to suit specific requirements.
- Font Size : The font size or text size is how large the characters displayed on a screen or printed on a page are.
Approach: To change the font size of tick labels, one should follow some basic steps that are given below:
- Import Libraries.
- Create or import data.
- Plot a graph on data using matplotlib.
- Change the font size of tick labels. (this can be done by different methods)
To change the font size of tick labels, any of three different methods in contrast with the above mentioned steps can be employed. These three methods are:
- fontsize in plt.xticks/plt.yticks()
- fontsize in ax.set_yticklabels/ax.set_xticklabels()
- labelsize in ax.tick_params()
Lets discuss implementation of these methods one by one with the help of examples:
Example 1: (Using plt.xticks/plt.yticks)
Python3
import matplotlib.pyplot as plt
x = list(range(1, 11, 1))
y = [s*s for s in x]
plt.plot(x, y)
plt.yticks(fontsize=20)
plt.show()
|
Output :

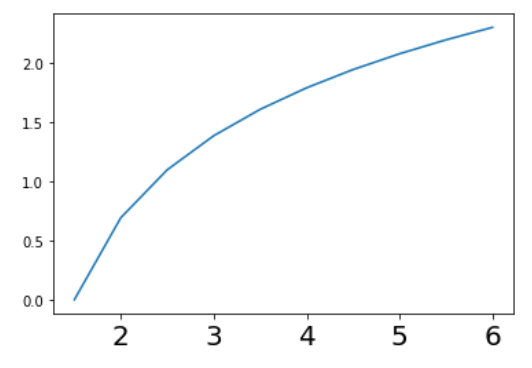
Example 2: (Using ax.set_yticklabels/ax.set_xticklabels)
Python3
import matplotlib.pyplot as plt
import numpy as np
x = list(range(1, 11, 1))
y = np.log(x)
fig, ax = plt.subplots()
ax.plot(x, y)
ax.set_xticklabels(x, fontsize=20)
plt.show()
|
Output :
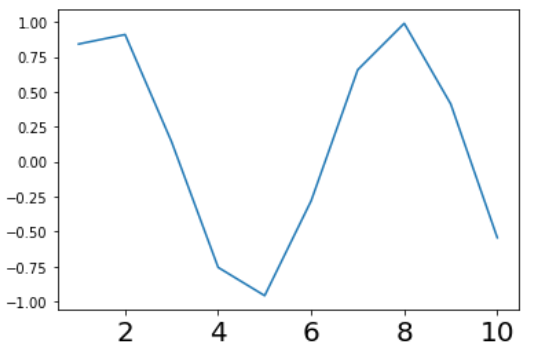
Example 3: (Using ax.tick_params)
Python3
import matplotlib.pyplot as plt
import numpy as np
x = list(range(1, 11, 1))
y = np.sin(x)
fig, ax = plt.subplots(1, 1)
ax.plot(x, y)
ax.tick_params(axis='x', labelsize=20)
plt.show()
|
Output:
Like Article
Suggest improvement
Share your thoughts in the comments
Please Login to comment...