How to Reverse Axes in Matplotlib?
Last Updated :
03 Sep, 2021
In Matplotlib we can reverse axes of a graph using multiple methods. Most common method is by using invert_xaxis() and invert_yaxis() for the axes objects. Other than that we can also use xlim() and ylim(), and axis() methods for the pyplot object.
Method 1: Using invert_xaxis() and invert_yaxis() method
To invert X-axis and Y-axis, we can use invert_xaxis() and invert_yaxis() function. We can invert either any one of the axes or both axes using the above methods.
Code:
Python3
import numpy as np
import matplotlib.pyplot as plt
x = np.linspace(5, 15, 35)
y = 3*x+4
graph, (plot1, plot2) = plt.subplots(1, 2)
plot1.plot(x, y)
plot1.set_title("Normal Plot")
plot2.plot(x, y)
plot2.set_title("Inverted Plot")
plot2.invert_xaxis()
plot2.invert_yaxis()
graph.tight_layout()
plt.show()
|
Output:
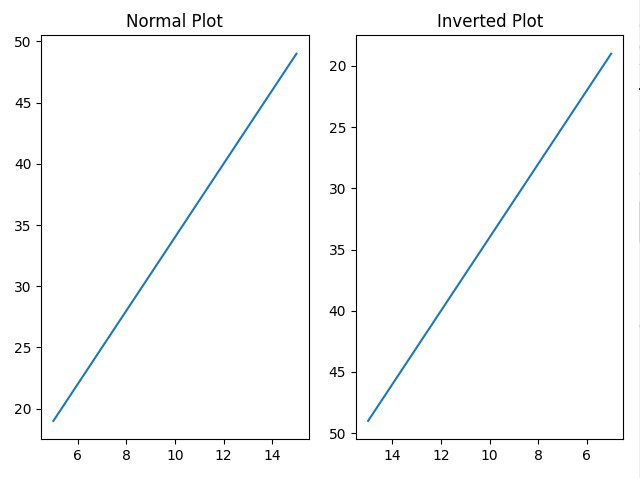
Normal Plot and Inverted Plot (Both axes inverted)
Method 2: Using xlim() and ylim() method
xlim() and ylim() can also be used to invert axes of a graph plot. They are generally used to set or get limits for X-axis and Y-axis respectively. But if we pass the minimum value in the axis as the upper limit and maximum value in the axis as the lower limit we can get a reverted axis.
Code:
Python3
import numpy as np
import matplotlib.pyplot as plt
x = np.linspace(5, 15, 35)
y = 3*x+4
graph, (plot1, plot2) = plt.subplots(1, 2)
plot1.plot(x, y)
plot1.set_title("Normal Plot")
plot2.plot(x, y)
plot2.set_title("Inverted Plot")
plt.xlim(max(x), min(x))
plt.ylim(max(y), min(y))
graph.tight_layout()
plt.show()
|
Output:
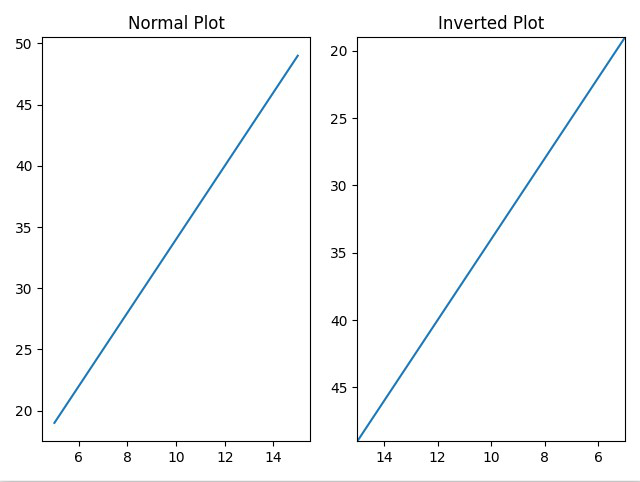
Normal Plot and Inverted Plot (Both axes inverted)
Method 3: Using axis() method
Similar to xlim() and ylim(), axis() method is also used to set the minimum and maximum values of the X-axis and Y-axis. So, if we pass the minimum value in the axis as the upper limit and the maximum value in the axis as the lower limit we can get a reverted axis.
Code:
Python3
import numpy as np
import matplotlib.pyplot as plt
x = np.linspace(5, 15, 35)
y = 3*x+4
graph, (plot1, plot2) = plt.subplots(1, 2)
plot1.plot(x, y)
plot1.set_title("Normal Plot")
plot2.plot(x, y)
plot2.set_title("Inverted Plot")
plt.axis([max(x), min(x), max(y), min(y)])
graph.tight_layout()
plt.show()
|
Output:
Like Article
Suggest improvement
Share your thoughts in the comments
Please Login to comment...