How to resize Matplotlib RadioButtons?
Last Updated :
30 Aug, 2021
Matplotlib is an amazing visualization library in Python for 2D plots of arrays. Matplotlib is a multi-platform data visualization library built on NumPy arrays and designed to work with the broader SciPy stack.
Radio buttons are the most commonly used widgets in visualization. Radio buttons let us choose between multiple options in a visualization. In this case, the buttons let the user choose one of the three different colors for the sine wave to be shown in the plot.
This is the simple visualization of the radio buttons.
Python3
import numpy as np
import matplotlib.pyplot as plt
from matplotlib.widgets import RadioButtons
t = np.arange(0.0, 1.0, 0.01)
s0 = np.sin(2*np.pi*t)
fig, ax = plt.subplots()
l, = ax.plot(t, s0, lw=2, color='red')
plt.subplots_adjust(left=0.3)
axcolor = 'lightgoldenrodyellow'
rax = plt.axes([0.05, 0.4, 0.15, 0.30],
facecolor=axcolor)
radio = RadioButtons(rax, ('red', 'blue', 'green'))
plt.show()
|
Output:
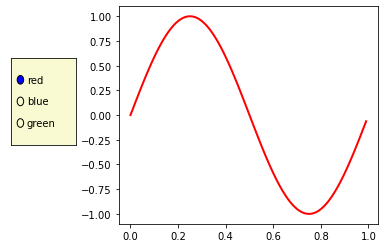
In the above code, plt.axes() adds axes to the current figure and makes it the current axes. The first argument is 4-tuple of floats for the box = [left, bottom, width, height]. The second parameter is **kwargs. This method also takes the keyword arguments for the returned axes class. It can be facecolor, figure, etc. In method RadioButtons(), the first argument is the axes created above and the second argument is the tuple of the labels we want.
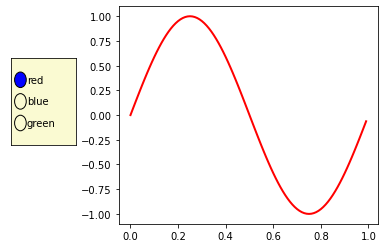
Resizing the radius of the circles in the Radio Button
The default size of the circle is 0.05. We add a simple line as shown below to change the radius. If the radius of the circle is greater than 0.05 say 0.09.
Python3
import numpy as np
import matplotlib.pyplot as plt
from matplotlib.widgets import RadioButtons
t = np.arange(0.0, 1.0, 0.01)
s0 = np.sin(2*np.pi*t)
fig, ax = plt.subplots()
l, = ax.plot(t, s0, lw=2, color='red')
plt.subplots_adjust(left=0.3)
axcolor = 'lightgoldenrodyellow'
rax = plt.axes([0.05, 0.4, 0.15, 0.30],
facecolor=axcolor)
radio = RadioButtons(rax, ('red', 'blue', 'green'))
for circle in radio.circles:
circle.set_radius(0.09)
|
Output:
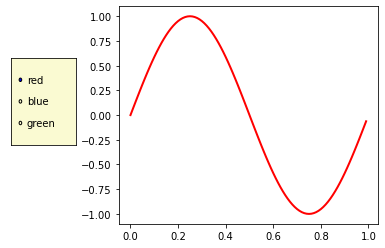
Here is another example where the radius of the circle is less than 0.05 say 0.02
Python3
import numpy as np
import matplotlib.pyplot as plt
from matplotlib.widgets import RadioButtons
t = np.arange(0.0, 1.0, 0.01)
s0 = np.sin(2*np.pi*t)
fig, ax = plt.subplots()
l, = ax.plot(t, s0, lw=2, color='red')
plt.subplots_adjust(left=0.3)
axcolor = 'lightgoldenrodyellow'
rax = plt.axes([0.05, 0.4, 0.15, 0.30],
facecolor=axcolor)
radio = RadioButtons(rax, ('red', 'blue', 'green'))
for circle in radio.circles:
circle.set_radius(0.02)
|
Output:
Like Article
Suggest improvement
Share your thoughts in the comments
Please Login to comment...