How to resize a graph in ggplot2 in R?
Last Updated :
28 Feb, 2022
In this article, we are going to see how to resize the graph in ggplot2 in the R programming language. To resize the graph we like to use option() methods in R.
option() method: It returns the height and weight of the specific graph
Syntax: option(weight, height)
Resizing a graph in ggplot2
Here we are going to see three different examples, for this, we will create a dataframe and then set the width and height using option() methods and then plot the graph using ggplot2.
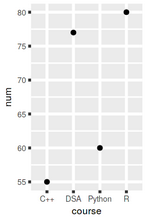
Example 1:
Under this example, we are plotting a point plot with height 3 and width 2.
R
library(ggplot2)
val <-data.frame(course=c('DSA','C++','R','Python'),
num=c(77,55,80,60))
options(repr.plot.width = 2, repr.plot.height =3)
ggplot(data=val, aes(x=course, y=num, group=1)) +geom_point()+
theme(text = element_text(size = 9),element_line(size =1))
|
Output:
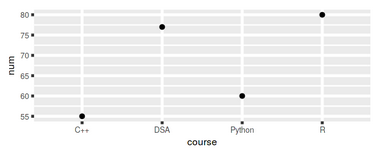
Example 2:
In this example, we have passed the width to be 5 and height to 2 to the option() function to resize the plot,
R
library(ggplot2)
val <-data.frame(course=c('DSA','C++','R','Python'),
num=c(77,55,80,60))
options(repr.plot.width = 5, repr.plot.height =2)
ggplot(data=val, aes(x=course, y=num, group=1)) +geom_point()+
theme(text = element_text(size = 9),element_line(size =1))
|
Output:
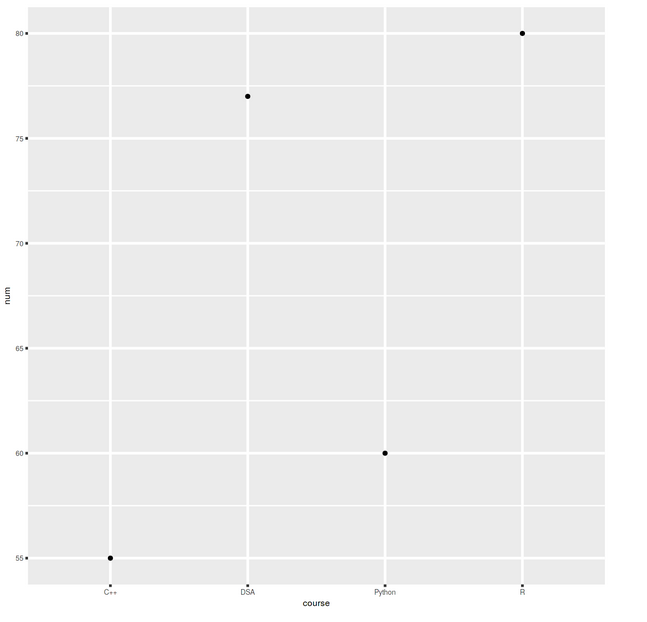
Example 3:
In this example, we have kept width to be 9 and height to 9 to resize the plot,
R
library(ggplot2)
val <-data.frame(course=c('DSA','C++','R','Python'),
num=c(77,55,80,60))
options(repr.plot.width =9, repr.plot.height =9)
ggplot(data=val, aes(x=course, y=num, group=1)) +geom_point()+
theme(text = element_text(size = 9),element_line(size =1))
|
Output:
Like Article
Suggest improvement
Share your thoughts in the comments
Please Login to comment...