How to reorder barplots with facetting with ggplot2 in R?
Last Updated :
15 Feb, 2023
In this article, we will discuss how to reorder bar plots with facetting using the ggplot2 package in the R Programming Language. We can draw a facet bar plot by using the geom_col() function with the facet_wrap() function of the ggplot2 package.
Syntax: ggplot( dataframe, aes( x, y ) ) + geom_col() + facet_wrap(~z)
Parameters:
- dataframe: Determines the dataframe to be used for plotting.
- x: Determines the x-axis vector column.
- y: Determines the y-axis vector column.
- z: Determines the variable around which plots have to be divided.
Creating a basic bar plot
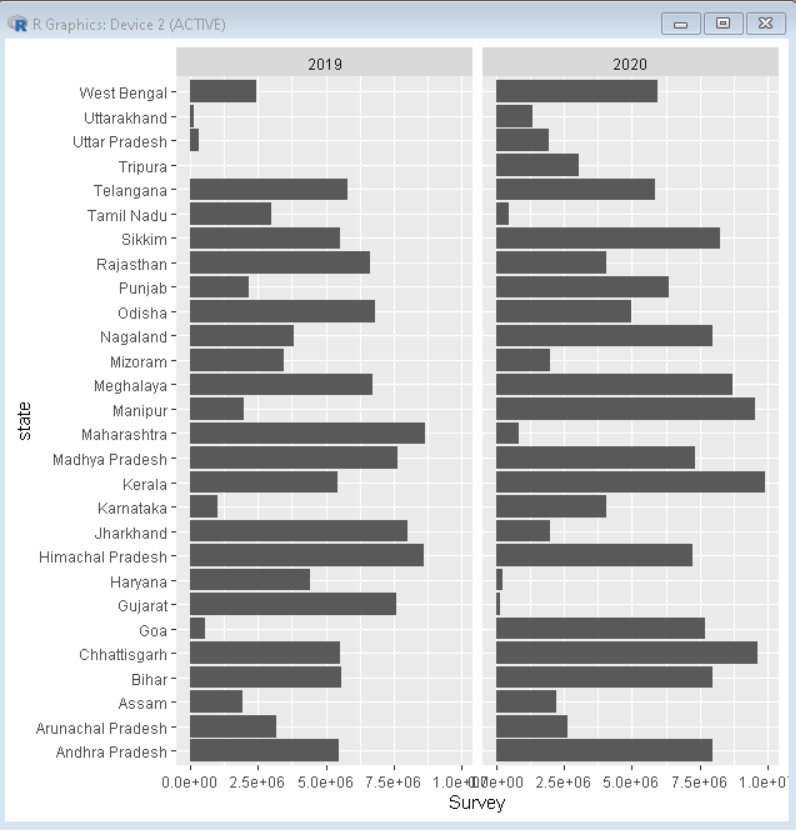
Here, is a basic bar plot with facetting using the facet_wrap() function.
Dataset Used: sample2
R
library(tidyverse)
sample_data <- readr::read_csv('sample2.csv')
ggplot(sample_data, aes(y=state, x=Survey))+
geom_col()+
facet_wrap(~Year)
|
Output:
Reorder barplot
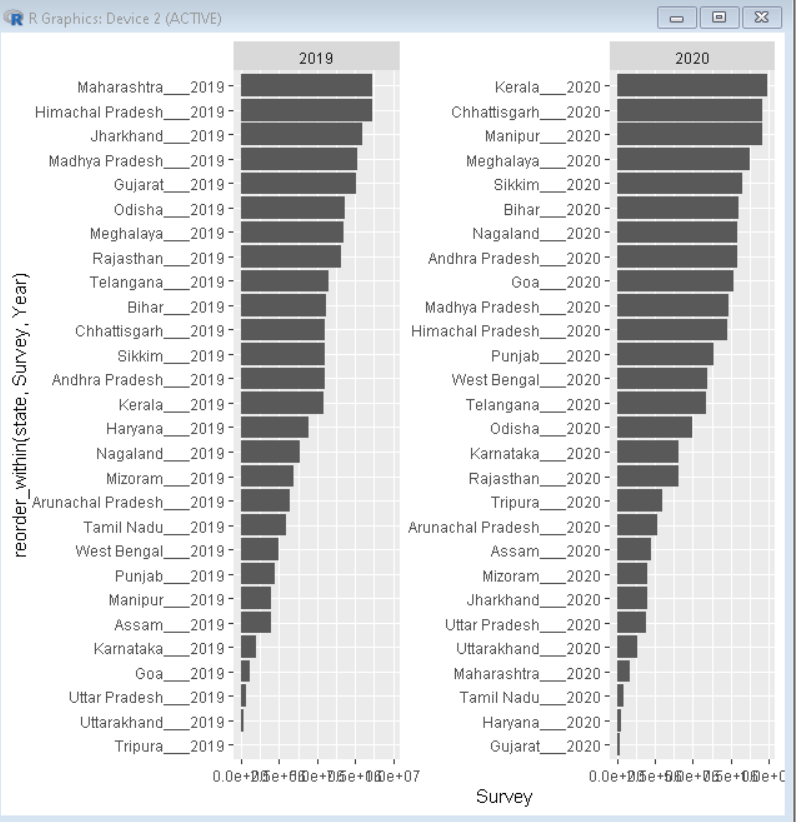
To reorder the bar plot for better visualization of data, we use the reorder_within() function of the tidytext package of the R Language. The reorder_within() function reorders a column before plotting with faceting, such that the values are ordered within each facet. But this creates a problem that after facetting all the columns that got divided in other facets also co-exist as an empty column for all other facets. To counter that we add scales parameter to facet_wrap() function with its value as free_y or free_x depending on the axis data needs to be freed.
Syntax: ggplot( dataframe, aes( reorder_within(x,y,z) , y ) ) + geom_col() + facet_wrap(~z, scales= “free_y/free_x”)
Parameters:
- dataframe: Determines the dataframe to be used for plotting
- x: Determines the x-axis vector column.
- y: Determines the y-axis vector column.
- z: Determines the variable around which plots have to be divided.
Example:
Here, is a basic bar plot with facetting using the facet_wrap() function. We have also reordered the barplot using the reorder_within() function of the tidytext package.
R
library(tidyverse)
library(tidytext)
sample_data <- readr::read_csv('sample2.csv')
ggplot(sample_data, aes(y=reorder_within(state,Survey, Year), x=Survey))+
geom_col()+
facet_wrap(~Year,scales="free_y")
|
Output:
Like Article
Suggest improvement
Share your thoughts in the comments
Please Login to comment...