How to put the y-axis in logarithmic scale with Matplotlib ?
Last Updated :
17 Dec, 2020
Axes’ in all plots using Matplotlib are linear by default, yscale() method of the matplotlib.pyplot library can be used to change the y-axis scale to logarithmic.
The method yscale() takes a single value as a parameter which is the type of conversion of the scale, to convert y-axes to logarithmic scale we pass the “log” keyword or the matplotlib.scale.LogScale class to the yscale method.
Syntax : matplotlib.pyplot.yscale(value, **kwargs)
Parameters:
- Value = { “linear”, “log”, “symlog”, “logit”, … }
- **kwargs = Different keyword arguments are accepted, depending on the scale (matplotlib.scale.LinearScale, LogScale, SymmetricalLogScale, LogitScale)
Returns : Converts the y-axes to the given scale type. (Here we use the “log” scale type)
Linear Scale Example :
Python3
import matplotlib.pyplot as plt
data = [10**i for i in range(4)]
plt.plot(data)
|
Output:
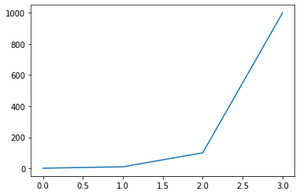
Linear Scale
Logarithmic Scale Example :
Python3
import matplotlib.pyplot as plt
data = [10**i for i in range(4)]
plt.yscale("log")
plt.plot(data)
|
Output:
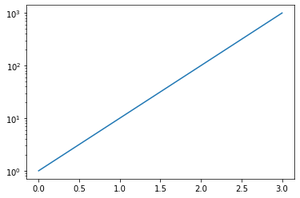
Logarithmic y-axis
Like Article
Suggest improvement
Share your thoughts in the comments
Please Login to comment...