How to put the title inside the plot using ggplot2 in R?
Last Updated :
08 Nov, 2022
A title to a plot gives information about the graph so that it is easier for the reader to interpret what relations the variables are supposed to depict. This article discusses how we can put a title inside a plot and further discusses various ways in which the title can be formatted. The examples are given below use bar plot.
To add title within a plot ggtitle() function is used.
Syntax:
ggtitle(“Title For Plot”)
Later to add this title to the plot we simply have to set margins.
Approach
- Specify the data object. it has to be a data frame, and it needs one numeric and one categorical variable.
- Call ggplot2() function and put first parameter ‘data’ and then set the aesthetics function ‘aes()’.
- Inside aes() function, set the categorical variable for the X axis, use the numeric for the Y axis.
- Call geom_bar() with ggtitle().
- Add margins
- Display plot
Example 1:
R
library(ggplot2)
data <- data.frame(
name=c("A","B","C","D","E") ,
value=c(3,12,5,18,45)
)
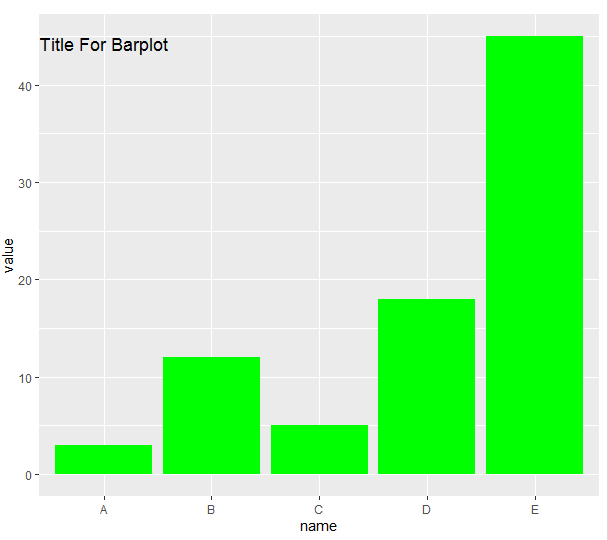
ggplot(data, aes(x=name, y=value)) +
geom_bar(stat = "identity", fill = "green")+
ggtitle("Title For Barplot")+
theme(plot.title=element_text(margin=margin(t=40,b=-30)))
|
Output:
Customization of Title of plot using ggplot2
It is a common need to set the title in several lines. To add a break in the title, simply write ‘\n’ in the text. If you want to bold or highlight some word(s) then just use expression() function. This section depicts how the title inserted can be formatted accordingly.
Example 1:
R
library(ggplot2)
data <- data.frame(
name=c("A","B","C","D","E") ,
value=c(3,12,5,18,45)
)
ggplot(data, aes(x=name, y=value)) +
geom_bar(stat = "identity", fill = "green")+
ggtitle("New Line Title \n For Barplot") +
theme_minimal()
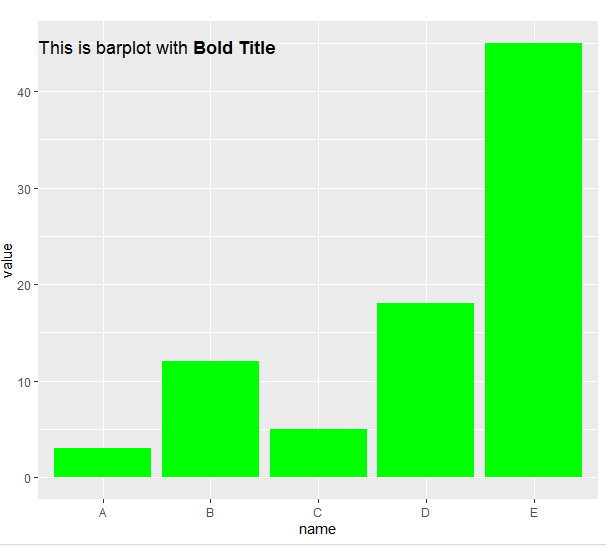
my_title <- expression(paste("This is barplot with ", bold("Bold Title")))
ggplot(data, aes(x=name, y=value)) +
geom_bar(stat = "identity", fill = "green")+
ggtitle(my_title) +
theme(plot.title=element_text(margin=margin(t=40,b=-30)))
|
Output:
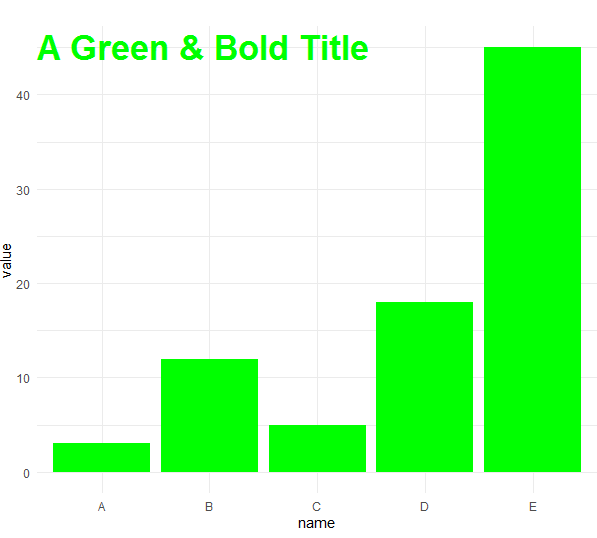
Now let’s modify our title appearance and position by theme() Function with plot.title parameter. The Appearance can be adjusted with family, face, color, or size. When position can be changed using hjust & vjust.
Example 2:
R
library(ggplot2)
data <- data.frame(
name=c("A","B","C","D","E") ,
value=c(3,12,5,18,45)
)
ggplot(data, aes(x=name, y=value)) +
geom_bar(stat = "identity", fill = "green")+
ggtitle("A Green & Bold Title") +
theme_minimal() +
theme(
plot.title=element_text(family='', face='bold', colour='green', size=26, margin=margin(t=40,b=-30))
)
|
.
Output:
Example 3:
R
library(ggplot2)
data <- data.frame(
name=c("A","B","C","D","E") ,
value=c(3,12,5,18,45)
)
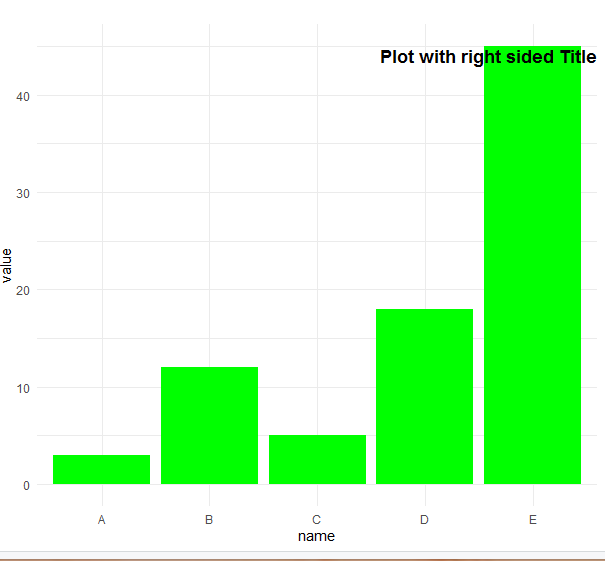
ggplot(data, aes(x=name, y=value)) +
geom_bar(stat = "identity", fill = "green")+
ggtitle("Plot with right sided Title") +
theme_minimal() +
theme(
plot.title=element_text( hjust=1, vjust=0.5, face='bold', margin=margin(t=40,b=-30))
)
|
Output:
Like Article
Suggest improvement
Share your thoughts in the comments
Please Login to comment...