How to Plot List of X, Y Coordinates in Matplotlib?
Last Updated :
17 Dec, 2020
Prerequisites:
Matplotlib is a comprehensive library for creating static, animated, and interactive visualizations in Python. To plot any data the most basic step starts with creating or loading it, this article discusses all the ways of passing the data to be plotted as list. While passing data as list one important thing to be kept in mind is to keep X,Y Lists of the same size, otherwise it will raise a ValueError.
Examples shown in this article use scatter plot, the same approaches can be applied to any other type of graph.
Method 1: Naive method
In this method, the coordinates are simply passed as two lists.
Approach
- Import module
- Create a list for X coordinates
- Create a list for Y coordinate
- Pass these two lists to plot the function
Example:
Python3
import matplotlib.pyplot as plt
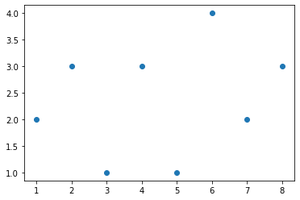
x = [1, 2, 3, 4, 5, 6, 7, 8]
y = [2, 3, 1, 3, 1, 4, 2, 3]
plt.scatter(x, y)
plt.show()
|
Output:
Method 2: Using numpy array
Function used: arrange()
Syntax: np.arange(start,end,step)
Parameters:
- Start: starting value
- End: ending value
- Step: step size, by default it is 1.
Approach
- Import module
- Create numpy array for coordinates
- Pass these arrays to plot
Example:
Python3
import numpy as np
import matplotlib.pyplot as plt
x = np.arange(1, 11, 1)
y = np.arange(10, 0, -1)
plt.scatter(x, y)
plt.show()
|
Output:

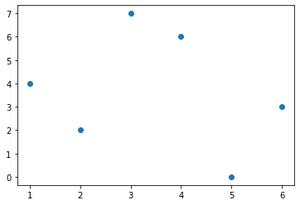
Method 3: List of lists
Creating lists of list of all points to be plotted can also one of the ways of achieving our requirement. After creating such a list it cannot be directly passed to plot, first a transpose needs to taken to get x and y coordinates.
Approach
- Import module
- Create list of lists for coordinates
- Take transpose
- Pass the coordinates to the plot
Example
Python3
import numpy as np
import matplotlib.pyplot as plt
data = np.array([
[1, 4],
[2, 2],
[3, 7],
[4, 6],
[5, 0],
[6, 3]
])
x, y = data.T
plt.scatter(x, y)
plt.show()
|
Output:
Like Article
Suggest improvement
Share your thoughts in the comments
Please Login to comment...