How to Plot Histogram from List of Data in Matplotlib?
Last Updated :
11 Feb, 2022
In this article, we are going to see how to Plot a Histogram from a List of Data in Matplotlib in Python.
The histogram helps us to plot bar-graph with specified bins and can be created using the hist() function.
Syntax: hist( dataVariable, bins=x, edgecolor=’anyColor’ )
Parameters:
- dataVariable- Any variable that holds a set of data. It can be a list or a column in a DataFrame etc.
- bins- It can be used to group the data in the DataVariable. It can accept an Integer or a list of numbers.
- edgecolor- It gives an edge color to each bin i.e., Each bar in histogram.
We can plot the histogram using data in the list by passing a list to hist method.
Example 1:
In this example, we passed the list to hist method to plot histogram from list of data. Here we didn’t specify edgecolor and bins parameters in hist method. So in the above output, we didn’t find any edge color to any bar and we got a random number of bins (bars).
Python3
import matplotlib.pyplot as plt
weights = [30, 50, 45, 80, 76, 55,
45, 47, 50, 65]
plt.hist(weights)
plt.xlabel('weight')
plt.ylabel('Person count')
plt.show()
|
Output:

Example 2:
To the same data that we used in the above example, we will specify bins and edgecolor additionally in this example.
Python3
import matplotlib.pyplot as plt
weights = [30, 50, 45, 80, 76, 55,
45, 47, 50, 65]
plt.hist(weights, bins=5, edgecolor='black')
plt.xlabel('weight')
plt.ylabel('Person count')
plt.show()
|
Output:

As we specified bin count as 5 we got 5 bars in the resultant plot and edgecolor helps us to distinguish bars between them if they are close to each other as the above scenario.
Example 3:
We can also pass list of values as an argument to bins parameter in hist method. It helps us to filter the data from the list.
Python3
import matplotlib.pyplot as plt
weights = [30, 50, 45, 80, 76, 55,
45, 47, 50, 65]
bins = [30, 40, 50, 60]
plt.hist(weights, bins=bins, edgecolor='black')
plt.xlabel('weight')
plt.ylabel('Person count')
plt.show()
|
Output:
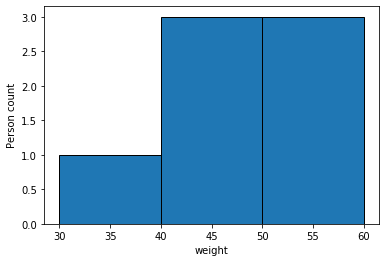
As we passed the list of bins that contains 30,40,50,60 to bins parameter, so while plotting histogram from list of data python only considers the data that are in the range of specified bins. so if the data value exceeds the range then that data point is not considered while plotting.
In the given list of data- 65,76,80 exceeds the bin range so, those data points are not considered during plotting the graph.
Share your thoughts in the comments
Please Login to comment...