How to plot data from a text file using Matplotlib?
Last Updated :
10 Feb, 2023
Perquisites: Matplotlib, NumPy
In this article, we will see how to load data files for Matplotlib. Matplotlib is a 2D Python library used for Date Visualization. We can plot different types of graphs using the same data like:
- Bar Graph
- Line Graph
- Scatter Graph
- Histogram Graph and many.
In this article, we will learn how we can load data from a file to make a graph using the “Matplotlib” python module. Here we will also discuss two different ways to extract data from a file. In the First Module, we will discuss extracting data using the inbuilt CVS module and In the Second Module, we will use a third-party “NumPy” Module to extract data from a file.
Requirement:
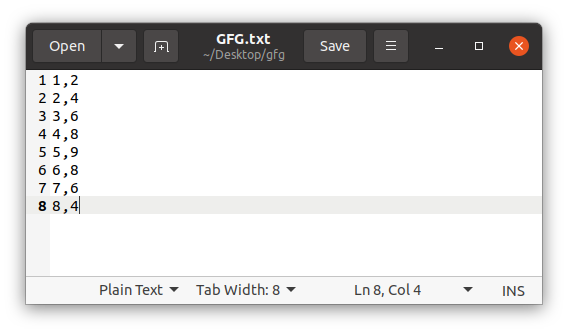
A text file from where data should be extracted. Let the file name = GFG.txt
Method 1: In this method, we will extract data using CSV module to load CVS files.
Step 1:
Import all required modules.
Python3
import matplotlib.pyplot as plt
import csv
|
Step 2: Create X and Y variables to store X-axis data and Y-axis data from a text file.
Python3
import matplotlib.pyplot as plt
import csv
X = []
Y = []
|
Step 3: Open text file in read mode. Pass ‘file_name’ and delimiter in reader function and store returned data in a new variable.
Python3
import matplotlib.pyplot as plt
import csv
X = []
Y = []
with open('GFG.txt', 'r') as datafile:
plotting = csv.reader(datafile, delimiter=',')
|
Step 4: Create a loop, that will append the data in X and Y variable.
Python3
import matplotlib.pyplot as plt
import csv
X = []
Y = []
with open('GFG.txt', 'r') as datafile:
plotting = csv.reader(datafile, delimiter=',')
for ROWS in plotting:
X.append(int(ROWS[0]))
Y.append(int(ROWS[1]))
|
Step 5: Now pass all the parameter in their respective functions.
Python3
import matplotlib.pyplot as plt
import csv
X = []
Y = []
with open('GFG.txt', 'r') as datafile:
plotting = csv.reader(datafile, delimiter=',')
for ROWS in plotting:
X.append(int(ROWS[0]))
Y.append(int(ROWS[1]))
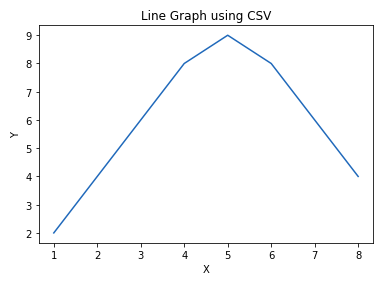
plt.plot(X, Y)
plt.title('Line Graph using CSV')
plt.xlabel('X')
plt.ylabel('Y')
plt.show()
|
Output:
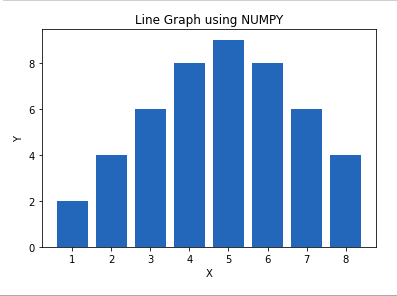
Method 2: In this method, we will extract data using numpy module to load files. Here you will notice that Step 2,3 and 4 are replaced by np.loadtxt( )
Python3
import matplotlib.pyplot as plt
import numpy as np
X, Y = np.loadtxt('GFG.txt', delimiter=',', unpack=True)
plt.bar(X, Y)
plt.title('Line Graph using NUMPY')
plt.xlabel('X')
plt.ylabel('Y')
plt.show()
|
Output:
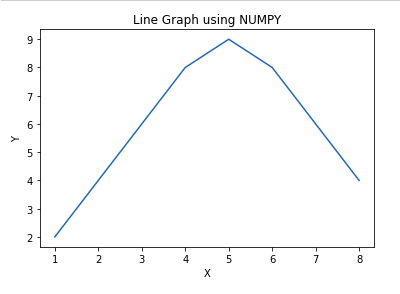
You can also try other different graphs by just changing 1 line
plt.plot(X,Y) to plt.scatter(X,Y) or plt.plot(X,Y)
Python3
import matplotlib.pyplot as plt
import numpy as np
X, Y = np.loadtxt('GFG.txt', delimiter=',', unpack=True)
plt.plot(X, Y)
plt.title('Line Graph using NUMPY')
plt.xlabel('X')
plt.ylabel('Y')
plt.show()
|
Output:
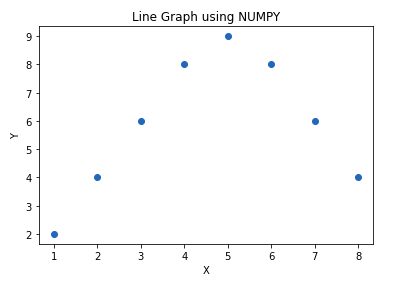
Python3
import matplotlib.pyplot as plt
import numpy as np
X, Y = np.loadtxt('GFG.txt', delimiter=',', unpack=True)
plt.scatter(X, Y)
plt.title('Line Graph using NUMPY')
plt.xlabel('X')
plt.ylabel('Y')
plt.show()
|
Output:
Like Article
Suggest improvement
Share your thoughts in the comments
Please Login to comment...