In this article, we will discuss plotting a subset of a data frame using ggplot2 in the R programming language.
Dataframe in use:
| |
Age |
Score |
EnrollNo |
| 1 |
17 |
70 |
05 |
| 2 |
18 |
80 |
10 |
| 3 |
17 |
79 |
15 |
| 4 |
19 |
75 |
20 |
| 5 |
18 |
85 |
25 |
| 6 |
19 |
96 |
30 |
| 7 |
17 |
90 |
35 |
| 8 |
19 |
71 |
40 |
| 9 |
18 |
83 |
45 |
To get a complete picture, let us first draw a complete data frame.
Example:
R
library(ggplot2)
Age <- c("17", "18", "17", "19", "18", "19",
"17", "19", "18")
EnrollNo <- c("05", "10", "15", "20", "25",
"30", "35", "40", "45")
Score <- c("70", "80", "79", "75", "85", "96",
"90", "71", "83")
data <- data.frame(Age, EnrollNo, Score)
ggplot(data, aes(Score, EnrollNo)) +
geom_point(color = "green", size = 3)
|
Output:
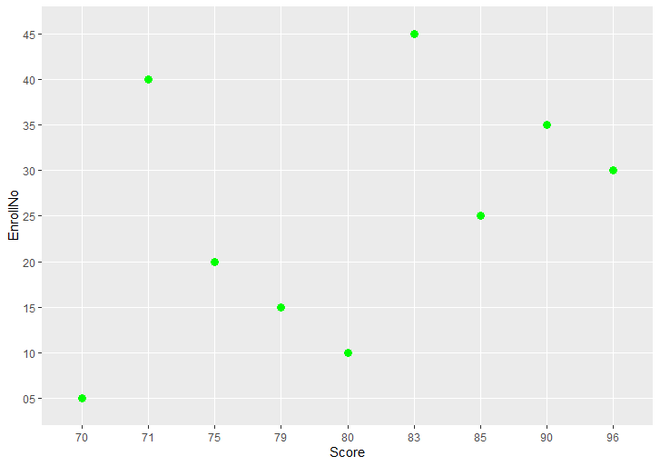
Simple Scatter Plot
The library(ggplot2) command is used to load the ggplot2 package at the beginning of the program.
The next step is to build the three vectors Age, EnrollNo, and Score. The data points that will be plotted in the scatter plot are represented by these vectors.
Using the data.frame() function, a data frame with the name data is produced. The data frame is created by columnar combining the vectors Age, EnrollNo, and Score.
The plot is initialized using the ggplot() function. The data frame (data) is specified as the first parameter for the ggplot() function, and variables are mapped to aesthetics using the aes() method. In this instance, the x-axis is mapped to Score, and the y-axis is mapped to EnrollNo.
Map the aesthetics of variables. In this instance, the x-axis is mapped to Score, and the y-axis is mapped to EnrollNo.
Using the + operator, the geom_point() function is added to the plot. The individual data points are added to the plot as points using this function. The size parameter is set to 3, and the color parameter is set to “green” to select the color and size of the points.
The print() function or just displaying the plot object can be used to display the generated plot.
If you run this code, you ought to see a scatter plot with the values of Score on the x-axis and EnrollNo on the y-axis. A green dot on the graph represents each data point.
Method 1: Using the subset() function
Here, we use the subset() function for plotting only a subset of DataFrame inside ggplot() function in place of data DataFrame. All other things are identical.
Syntax: subset(obj, …)
Parameters:
- It takes data object to be subsetted as it’s first parameter.
- subset() function can have many other parameters. only obj is necessary to take. here we only use logical expression indicating rows as a second argument.
Return : subset() function returns subset of DataFrame.
Example:
R
library(ggplot2)
Age <- c("17", "18", "17", "19", "18", "19",
"17", "19", "18")
EnrollNo <- c("05", "10", "15", "20", "25",
"30", "35", "40", "45")
Score <- c("70", "80", "79", "75", "85", "96",
"90", "71", "83")
data <- data.frame(Age, EnrollNo, Score)
ggplot(subset(data, Age %in% "18"), aes(Score, EnrollNo)) +
geom_point(color = "green", size = 3)
|
Output:
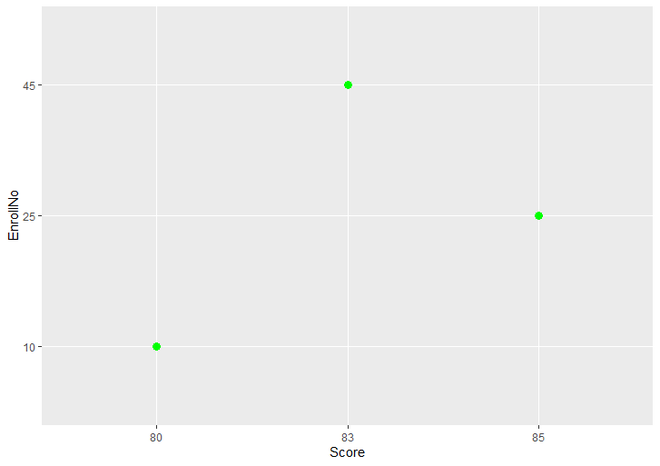
Scatter Plot using only a subset of DataFrame by sunset() function
This code explains how to make a scatter plot in R for a subset of data based on a condition using the ggplot2 library. Let’s dissect the code:
The library(ggplot2) command is used to load the ggplot2 package at the beginning of the programme.
Age, EnrollNo, and Score are three vectors that are produced to represent the data points that will be presented in the scatter plot.
By combining the vectors Age, EnrollNo, and Score column-wise, the data.frame() function creates a data frame with the name data.
The plot is initialized using the ggplot() function. The data frame (data) is specified as the first parameter for the ggplot() function, and variables are mapped to aesthetics using the aes() method. In this instance, the x-axis is mapped to Score, and the y-axis is mapped to EnrollNo.
To construct a subset of the data depending on a condition, use the subset() function. Age%in% “18” in this instance filters the data to only include rows with the value “18” for the Age variable.
Using the + operator, the geom_point() function is added to the plot. The individual data points are added to the plot as points using this function. To specify the colour of the points, the colour parameter is set to “green”, and If you run this code, you will get a scatter plot with the values of Score on the x-axis and EnrollNo on the y-axis, but only for the portion of the data when the Age variable is set to “18”. A green point on the plot corresponds to each data point in the subset. This code demonstrates how to use ggplot2 with R’s subset() function to make a scatter plot for a certain subset of data based on a condition.
Method 2: Using Square Brackets
In this method, we are not using the subset() function, but we write logical expressions to retrieve a subset of DataFrame in Square Brackets and assign it to a subset variable.
Example:
R
library(ggplot2)
Age <- c("17", "18", "17", "19", "18", "19",
"17", "19", "18")
EnrollNo <- c("05", "10", "15", "20", "25",
"30", "35", "40", "45")
Score <- c("70", "80", "79", "75", "85", "96",
"90", "71", "83")
data <- data.frame(Age, EnrollNo, Score)
data_subset <- data[data$Age %in% "19", ]
ggplot(data_subset, aes(Score, EnrollNo)) +
geom_point(color = "green", size = 3)
|
Output:
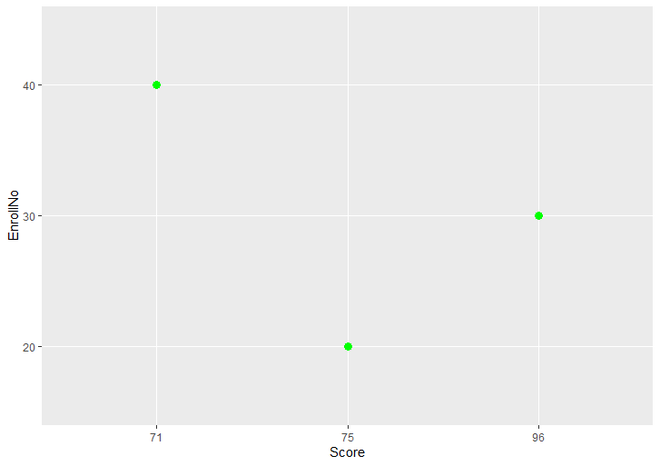
Scatter Plot using only a subset of DataFrame by Square Brackets
This code explains how to make a scatter plot in R for a subset of data based on a condition using the ggplot2 library. Let’s dissect the code:
The library(ggplot2) command is used to load the ggplot2 package at the beginning of the programme.
Age, EnrollNo, and Score are three vectors that are produced to represent the data points that will be presented in the scatter plot.
By combining the vectors Age, EnrollNo, and Score column-wise, the data.frame() function creates a data frame with the name data.
Indexing on the data data frame is used to construct the data_subset variable. The Age variable has the value “19,” therefore the condition data$Age%in% “19” filters the rows where it does. The data_subset variable receives the generated subset as its value.
The plot is initialized using the ggplot() function. The data frame is specified by the first argument of the ggplot() function (data_subset), and variables are mapped to aesthetics using the aes() function. In this instance, the x-axis is mapped to Score, and the y-axis is mapped to EnrollNo.
Using the + operator, the geom_point() function is added to the plot. The individual data points are added to the plot as points using this function. The size parameter is set to “small” and the colour parameter is set to “green” to choose the colour of the points.
Method 3: Using Square Brackets inside ggplot() Function
In this method, We use square brackets to write expressions for a subset of DataFrame, but we use it inside ggplot() function in place of the data frame object.
Example
R
library(ggplot2)
Age <- c("17", "18", "17", "19", "18", "19",
"17", "19", "18")
EnrollNo <- c("05", "10", "15", "20", "25",
"30", "35", "40", "45")
Score <- c("70", "80", "79", "75", "85", "96",
"90", "71", "83")
data <- data.frame(Age, EnrollNo, Score)
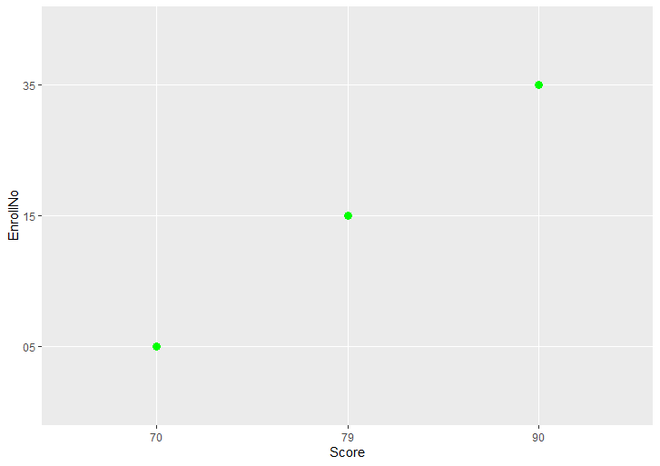
ggplot(data[data$Age %in% "17", ], aes(Score, EnrollNo)) +
geom_point(color = "green", size = 3)
|
Output:
This code explains how to make a scatter plot in R for a subset of data based on a condition using the ggplot2 library. Let’s dissect the code:
The library(ggplot2) command is used to load the ggplot2 package at the beginning of the programme.
Age, EnrollNo, and Score are three vectors that are produced to represent the data points that will be presented in the scatter plot.
By combining the vectors Age, EnrollNo, and Score column-wise, the data.frame() function creates a data frame with the name data.
The plot is initialized using the ggplot() function. The data frame (data[data$Age%in% “17”,]), which only contains the rows when the Age variable has the value “17,” is specified by the first parameter of the ggplot() function. Indexing using the condition data$Age%in% “17” is used to achieve this. Variables can be mapped to aesthetics using the aes() function. In this instance, the x-axis is mapped to Score, and the y-axis is mapped to EnrollNo.
Using the + operator, the geom_point() function is added to the plot. The individual data points are added to the plot as points using this function. The size parameter is set to 3, and the colour parameter is set to “green” to select the color and size of the points.
If we run this code, you will get a scatter plot with the values of Score on the x-axis and EnrollNo on the y-axis, but only for the portion of the data where the Age variable is set to “17”. A green point on the plot corresponds to each data point in the subset. This code demonstrates how to use indexing and ggplot2 in R to generate a scatter plot for a certain subset of data based on a condition.
Like Article
Suggest improvement
Share your thoughts in the comments
Please Login to comment...