How to Plot a Smooth Curve in Matplotlib?
Last Updated :
23 Jan, 2023
Prerequisite: Introduction to Matplotlib
Many times we have line plots generated from lists of data that are quite scattered which makes graphs seem like straight lines connecting dots or quite dense which leads to the data points being extremely close to each other and hence the plot looks cluttered.
The matplotlib.pyplot.plot() function by default produces a curve by joining two adjacent points in the data with a straight line, and hence the matplotlib.pyplot.plot() function does not produce a smooth curve for a small range of data points.
Example:
Python
import numpy as np
import matplotlib.pyplot as plt
x = np.array([ 1, 2, 3, 4, 5, 6, 7, 8 ])
y = np.array([ 20, 30, 5, 12, 39, 48, 50, 3 ])
plt.plot(x, y)
plt.title("Curve plotted using the given points")
plt.xlabel("X")
plt.ylabel("Y")
plt.show()
|
Output:
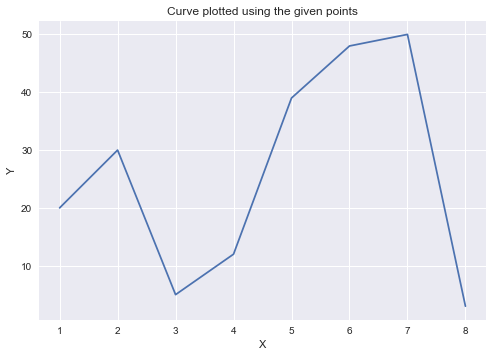
Observe that the plot is not at all smooth since the underlying data doesn’t follow a smooth line. To plot a smooth curve, we first fit a spline curve to the curve and use the curve to find the y-values for x values separated by an infinitesimally small gap. We can get a smooth curve by plotting those points with a very infinitesimally small gap.
We can use the following methods to create a smooth curve for this dataset :
1. Smooth Spline Curve with PyPlot:
It plots a smooth spline curve by first determining the spline curve’s coefficients using the scipy.interpolate.make_interp_spline(). We use the given data points to estimate the coefficients for the spline curve, and then we use the coefficients to determine the y-values for very closely spaced x-values to make the curve appear smooth. Here we will be using np.linspace() method which returns evenly spaced samples, calculated over a specified interval. Optional parameter num is the number of samples to generate within the range start and stop. The default value is 50 and must be non-negative. We want this parameter to be of a sufficiently high value to generate a smooth curve. Let’s take 500 equally spaced samples between min and max values along the X-axis to plot the curve.
Syntax:
numpy.linspace(start, stop, num = 50, endpoint = True, retstep = False, dtype = None, axis = 0)
X_Y_Spline = scipy.interpolate.make_interp_spline(x, y)
Example:
Python
import numpy as np
import numpy as np
from scipy.interpolate import make_interp_spline
import matplotlib.pyplot as plt
x = np.array([1, 2, 3, 4, 5, 6, 7, 8])
y = np.array([20, 30, 5, 12, 39, 48, 50, 3])
X_Y_Spline = make_interp_spline(x, y)
X_ = np.linspace(x.min(), x.max(), 500)
Y_ = X_Y_Spline(X_)
plt.plot(X_, Y_)
plt.title("Plot Smooth Curve Using the scipy.interpolate.make_interp_spline() Class")
plt.xlabel("X")
plt.ylabel("Y")
plt.show()
|
Output:

2. Spline Curve Using Cubic Interpolation
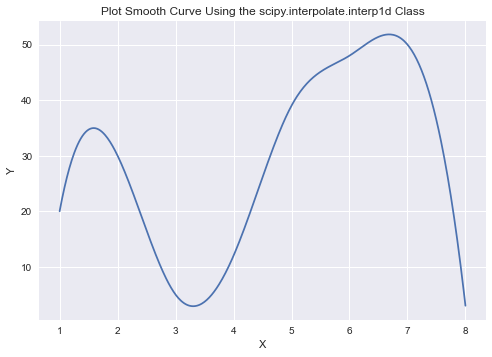
It generates a cubic interpolation curve using the scipy.interpolate.interp1d class, and then we use the curve to determine the y-values for closely spaced x-values for a smooth curve. Here also we will be using np.linspace() method which returns evenly spaced samples, calculated over a specified interval. Let’s take 500 equally spaced samples between min and max values along the X-axis to plot the curve. Depending on how curved you want the line to be, you can modify the value for the third(num) parameter.
Syntax:
numpy.linspace(start, stop, num=50, endpoint=True, retstep=False, dtype=None, axis=0)
cubic_interpolation_model=scipy.interpolate.interp1d(x,y,kind=”cubic”)
Example:
Python
import numpy as np
from scipy.interpolate import interp1d
import matplotlib.pyplot as plt
x=np.array([1, 2, 3, 4, 5, 6, 7, 8])
y=np.array([20, 30, 5, 12, 39, 48, 50, 3])
cubic_interpolation_model = interp1d(x, y, kind = "cubic")
X_=np.linspace(x.min(), x.max(), 500)
Y_=cubic_interpolation_model(X_)
plt.plot(X_, Y_)
plt.title("Plot Smooth Curve Using the scipy.interpolate.interp1d Class")
plt.xlabel("X")
plt.ylabel("Y")
plt.show()
|
Output:
Like Article
Suggest improvement
Share your thoughts in the comments
Please Login to comment...