How to plot a simple vector field in Matplotlib ?
Last Updated :
20 Apr, 2022
The quantity incorporating both magnitude and direction is known as Vectors. In simple words, we can say, Vector Field is an engagement or collaboration of such vectors in a subset of space. Vector fields are the key aspects of understanding our real-life surrounding.
For more intuition, you can think of a vector field as representing a multivariable function whose input and output spaces each have the same dimension. The length of arrows drawn in a vector field is usually not to scale, but the ratio of the length of one vector to another should be accurate.
In this article, we are going to discuss how to plot a vector field in python. In order to perform this task we are going to use the quiver() method and the streamplot() method in matplotlib module.
Syntax:
To plot a vector field using the quiver() method:
matplotlib.pyplot.quiver(X, Y, U, V, **kw)
Where X, Y define the Vector location and U, V are directional arrows with respect of the Vector location.
To plot a vector field using the streamplot() method:
matplotlib.pyplot.streamplot(X, Y, U, V, density=1, linewidth=None, color=None, **kw)
Where X, Y are evenly spaced grid[1D array] and U and V represent the stream velocity of each point present on the grid. Density is the no. of vector per area of the plot. Line width represents the thickness of streamlines.
Below are some examples which depict how to plot vector fields using matplotlib module:
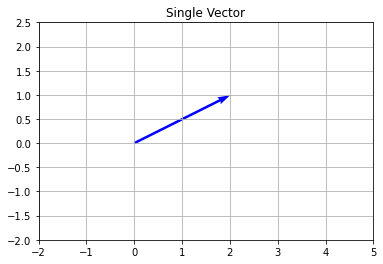
Example 1: Plotting a single vector using quiver() method in matplotlib module.
Python3
import numpy as np
import matplotlib.pyplot as plt
X = [0]
Y = [0]
U = [2]
V = [1]
plt.quiver(X, Y, U, V, color='b', units='xy', scale=1)
plt.title('Single Vector')
plt.xlim(-2, 5)
plt.ylim(-2, 2.5)
plt.grid()
plt.show()
|
Output:
Example 2: Generating multiple vectors using quiver() method.
Python3
import numpy as np
import matplotlib.pyplot as plt
x, y = np.meshgrid(np.linspace(-5, 5, 10),
np.linspace(-5, 5, 10))
u = -y/np.sqrt(x**2 + y**2)
v = x/(x**2 + y**2)
plt.quiver(x, y, u, v, color='g')
plt.title('Vector Field')
plt.xlim(-7, 7)
plt.ylim(-7, 7)
plt.grid()
plt.show()
|
Output:

Example 3: Plotting multiple vectors using streamplot() method in matplotlib module.
Python3
import numpy as np
import matplotlib.pyplot as plt
x = np.arange(-5,5,0.1)
y = np.arange(-5,5,0.1)
X,Y = np.meshgrid(x,y)
Ex = (X + 1)/((X+1)**2 + Y**2) - (X - 1)/((X-1)**2 + Y**2)
Ey = Y/((X+1)**2 + Y**2) - Y/((X-1)**2 + Y**2)
plt.figure(figsize=(10, 10))
plt.streamplot(X,Y,Ex,Ey, density=1.4, linewidth=None, color='#A23BEC')
plt.plot(-1,0,'-or')
plt.plot(1,0,'-og')
plt.title('Electromagnetic Field')
plt.grid()
plt.show()
|
Output:

Like Article
Suggest improvement
Share your thoughts in the comments
Please Login to comment...