How to plot a normal distribution with Matplotlib in Python ?
Last Updated :
03 Jan, 2021
Prerequisites:
Normal Distribution is a probability function used in statistics that tells about how the data values are distributed. It is the most important probability distribution function used in statistics because of its advantages in real case scenarios. For example, the height of the population, shoe size, IQ level, rolling a die, and many more.
The probability density function of normal or Gaussian distribution is given by:
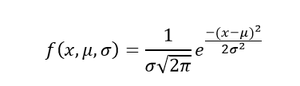
Probability Density Function
Where, x is the variable, mu is the mean, and sigma standard deviation
Modules Needed
- Matplotlib is python’s data visualization library which is widely used for the purpose of data visualization.
- Numpy is a general-purpose array-processing package. It provides a high-performance multidimensional array object, and tools for working with these arrays. It is the fundamental package for scientific computing with Python.
- Scipy is a python library that is useful in solving many mathematical equations and algorithms.
- Statistics module provides functions for calculating mathematical statistics of numeric data.
Functions used
- To calculate mean of the data
Syntax:
mean(data)
- To calculate standard deviation of the data
Syntax:
stdev(data)
- To calculate normal probability density of the data norm.pdf is used, it refers to the normal probability density function which is a module in scipy library that uses the above probability density function to calculate the value.
Syntax:
norm.pdf(Data, loc, scale)
Here, loc parameter is also known as the mean and the scale parameter is also known as standard deviation.
Approach
- Import module
- Create data
- Calculate mean and deviation
- Calculate normal probability density
- Plot using above calculated values
- Display plot
Below is the implementation.
Python3
import numpy as np
import matplotlib.pyplot as plt
from scipy.stats import norm
import statistics
x_axis = np.arange(-20, 20, 0.01)
mean = statistics.mean(x_axis)
sd = statistics.stdev(x_axis)
plt.plot(x_axis, norm.pdf(x_axis, mean, sd))
plt.show()
|
Output:
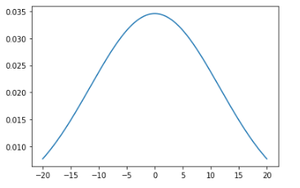
The output of above code
Like Article
Suggest improvement
Share your thoughts in the comments
Please Login to comment...