How to plot a graph in R using CSV file ?
Last Updated :
26 Mar, 2021
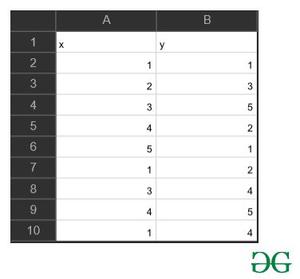
To plot a graph in R using a CSV file, we need a CSV file with two-column, the values in the first column will be considered as the points at the x-axis and the values in the second column will be considered as the points at the y-axis. In this article, we will be looking at the way to plot a graph using a CSV file in R language.
Approach
- Import csv file
- Pass required parameters to plot function
- Plot graph
- Display plot
Functions Used:
- To import/read the CSV file to the R console, the user must need to use the read.csv() function in R.This function will read a CSV file available in your current working directory.
Syntax:
read.csv(file)
- plot() function for plotting of R objects. With the provided parameters this function returns a scatter plot by default.
Syntax:
plot(x,y,main,xlab,ylab,sub,asp)
Parameters:
- x:-the x coordinates of points in the plot
- y:-the y coordinates of points in the plot
- main:-an overall title for the plot
- sub:-a subtitle for the plot
- xlab:-a title for the x-axis
- ylab:-a title for the y-axis
- asp:-the y/x aspect ratio
Return:
Scatter plot of the given x and y values.
Example:
R
data=read.csv('input_gfg.csv')
print(data)
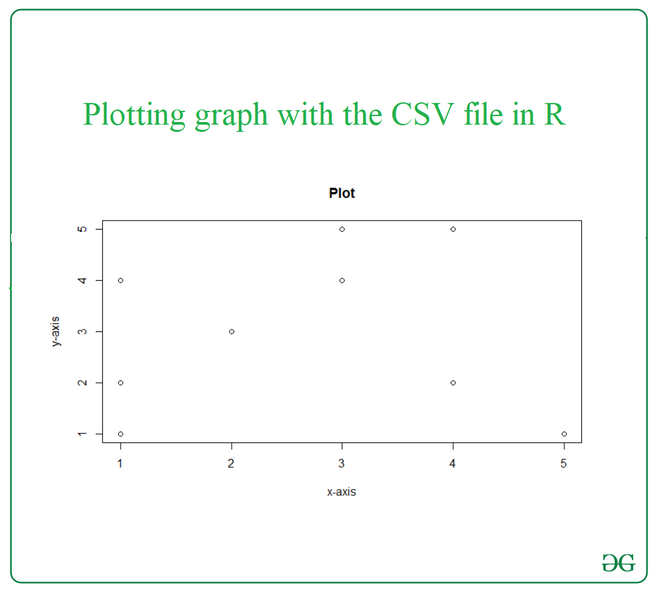
plot(x = data$x,y = data$y,
xlab = "x-axis",
ylab = "y-axis",
main = "Plot"
)
|
Output:
Like Article
Suggest improvement
Share your thoughts in the comments
Please Login to comment...