How to Place Legend Outside of the Plot in Matplotlib?
Last Updated :
26 Nov, 2022
In this article, we will see how to put the legend outside the plot.
Let’s discuss some concepts :
- Matplotlib: Matplotlib is an amazing visualization library in Python for 2D plots of arrays. Matplotlib is a multi-platform data visualization library built on NumPy arrays and designed to work with the broader SciPy stack. It was introduced by John Hunter in the year 2002.
- Legend: A legend is an area describing the elements of the graph. In the Matplotlib library, there’s a function called legend() which is used to Place a legend on the axes. The attribute Loc in legend() is used to specify the location of the legend. The default value of loc is loc= “best” (upper left).
Put the legend outside the plot
As, we can see that the above figure legends overlapped on the graph i.e; incomplete information. To solve this problem we need to place the legend outside the plot.
The syntax to set the legend outside is as given below:
matplotlib.pyplot.legend(bbox_to_anchor=(x,y))
Example 1:
Matplotlib set legend upper-left outside the plot.
Python3
import matplotlib.pyplot as plt
import numpy as np
x = np.linspace(0, 10, 100)
plt.plot(x, np.sin(x), label="sin(x)")
plt.plot(x, np.cos(x), label="cos(x)")
plt.legend(bbox_to_anchor=(1.05, 1.0), loc='upper left')
plt.tight_layout()
plt.show()
|
Output :
Example 2:
Matplotlib set legend center-left outside the plot.
Python3
import matplotlib.pyplot as plt
import numpy as np
x = np.linspace(0, 10, 100)
plt.plot(x, np.sin(x), label="sin(x)")
plt.plot(x, np.cos(x), label="cos(x)")
plt.legend(bbox_to_anchor = (1.25, 0.6), loc='center right')
plt.tight_layout()
plt.show()
|
Output:
Example 3:
Matplotlib set legend lower-right outside the plot.
Python3
import matplotlib.pyplot as plt
import numpy as np
x = np.linspace(0, 10, 100)
plt.plot(x, np.sin(x), label="sin(x)")
plt.plot(x, np.cos(x), label="cos(x)")
plt.legend(bbox_to_anchor =(1.44,-0.10), loc='lower right')
plt.tight_layout()
plt.show()
|
Output:
Example 4:
Matplotlib set legend upper-center outside the plot.
Python3
import matplotlib.pyplot as plt
import numpy as np
x = np.linspace(0, 10, 100)
plt.plot(x, np.sin(x), label="sin(x)")
plt.plot(x, np.cos(x), label="cos(x)")
plt.legend(bbox_to_anchor=(0.5, 1.2), loc='upper center')
plt.tight_layout()
plt.show()
|
Output :
Example 5:
Matplotlib set legend lower-center outside the plot
Python3
import matplotlib.pyplot as plt
import numpy as np
x = np.linspace(0, 10, 100)
plt.plot(x, np.sin(x), label="sin(x)")
plt.plot(x, np.cos(x), label="cos(x)")
plt.legend(bbox_to_anchor =(0.5,-0.27), loc='lower center')
plt.tight_layout()
plt.show()
|
Example 6:
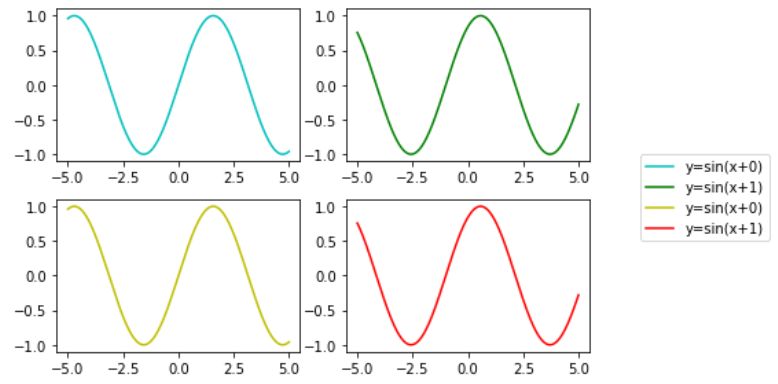
Place with subplots Legend Outside of the Plot
Python3
import numpy as np
import matplotlib.pyplot as plt
x = np.linspace(-5, 5, 1000)
colors=[['c','g'], ['y','r']]
fig, ax = plt.subplots(2, 2)
for i in range(2):
ax[0][i].plot(x, np.sin(x+i),
color = colors[0][i],
label = "y=sin(x+{})".format(i))
ax[1][i].plot(x, np.sin(x+i),
color = colors[1][i],
label = "y=sin(x+{})".format(i))
fig.legend(bbox_to_anchor=(1.3, 0.6))
fig.tight_layout()
plt.show()
|
Output :

Like Article
Suggest improvement
Share your thoughts in the comments
Please Login to comment...