How to Perform Univariate Analysis in R?
Last Updated :
01 Aug, 2023
In this article, we will discuss how to perform Univariate Analysis in R Programming Language. Univariate Analysis means doing an Analysis of one variable.
The analysis of univariate data is thus the simplest form of analysis since the information deals with only one quantity that changes.
Example: R program to create a vector with 10 elements and display the Summary statistics.
R
data = c(1: 10)
print(data)
|
Output:
[1] 1 2 3 4 5 6 7 8 9 10
Summary Statistics
Summary statistics include:
Minimum:
Get the Minimum element from the data.
Syntax:
min(data)
Output
[1] 1
Maximum:
Get the Maximum element from the data.
Syntax:
max(data)
Output:
[1] 10
Mean:
Get the mean of the given elements from the data.
Syntax:
mean(data)
Output
[1] 5.5
Median:
Get the median of the given elements from the data.
Syntax:
median(data)
Output
[1] 5.5
Inter Quartile Range:
Get the IQR of the given elements from the data.
Syntax:
IQR(data)
Output
[1] 4.5
Standard Deviation:
Get the standard deviation of the given elements from the data.
Syntax:
sd(data)
Output
[1] 3.02765
Range:
Get a range of the elements from the data.
Syntax:
max(data)-min(data)
R
print(max(data)-min(data))
|
Output
[1] 9
Frequency Table
We can display the frequency table using the table() method, This will return the count of element occurrence.
Syntax:
table(data)
Example:
R
data = c(1: 10)
print(data)
print(table(data))
|
Output:
[1]  1  2  3  4  5  6  7  8  9 10

display frequency table

data
 1  2  3  4  5  6  7  8  9 10
 1  1  1  1  1  1  1  1  1  1
Visualization
Here we can visualize the data using some plots
boxplot() function will result in a five-point summary(min, max, median, 1st quartile, 3rd quartile)
Syntax:
boxplot(data)
Example:
R
data = c(1: 10)
print(data)
print(boxplot(data))
|
Output:
$stats
     [,1]
[1,]  1.0
[2,]  3.0
[3,]  5.5
[4,]  8.0
[5,] 10.0

$n
[1] 10

$conf
         [,1]
[1,] 3.001801
[2,] 7.998199

$out
numeric(0)

$group
numeric(0)

$names
[1] "1"
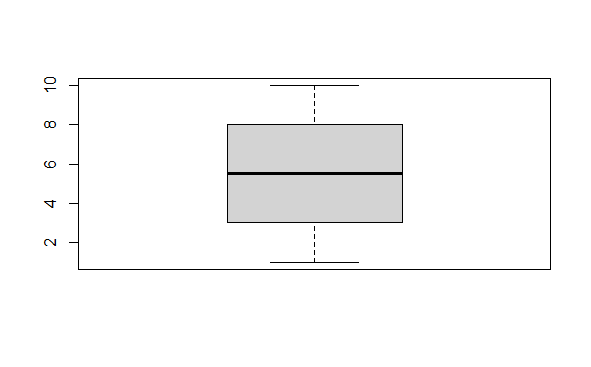
Box plot for univariate analysis in R
Histogram
This will return the histogram of the data and the function used is hist()
Syntax:
hist(data)
Example:
R
data = c(1: 10)
print(data)
print(hist(data))
|
Output:
[1]  1  2  3  4  5  6  7  8  9 10
$breaks
[1]  0  2  4  6  8 10

$counts
[1] 2 2 2 2 2

$density
[1] 0.1 0.1 0.1 0.1 0.1

$mids
[1] 1 3 5 7 9

$xname
[1] "data"

$equidist
[1] TRUE

attr(,"class")
[1] "histogram"
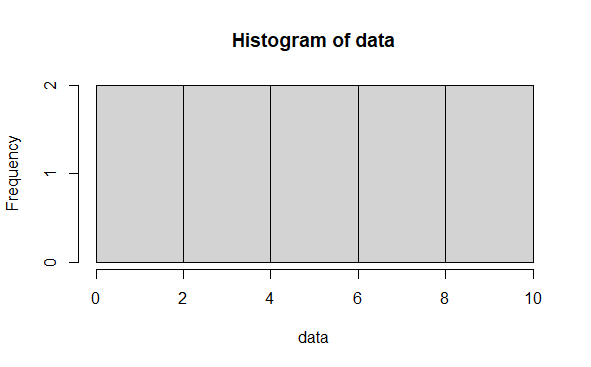
Histogram for univariate analysis in R
Density plot
This will display the density plot. We have to use the density() function along with the plot() function.
Syntax:
plot(density(data))
Example:
R
data = c(1: 10)
print(data)
print(plot(density(data)))
|
Output:
[1]  1  2  3  4  5  6  7  8  9 10
NULL
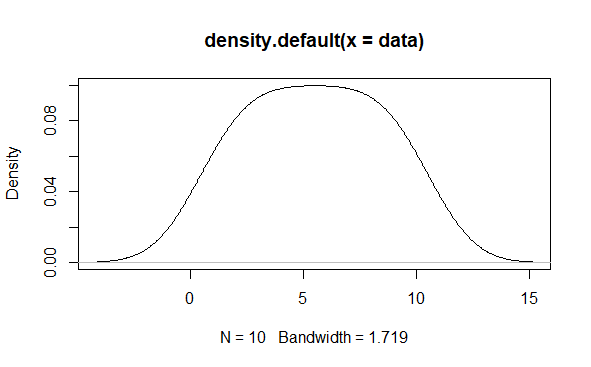
Density plot for univariate analysis in R
Like Article
Suggest improvement
Share your thoughts in the comments
Please Login to comment...