How to Perform an Augmented Dickey-Fuller Test in R
Last Updated :
22 Mar, 2022
Augmented Dickey-Fuller Test: It is a common test in statistics and is used to check whether a given time series is at rest. A given time series can be called stationary or at rest if it doesn’t have any trend and depicts a constant variance over time and follows autocorrelation structure over a period constantly.
Hypothesis involved:
The following two null and alternate hypotheses are involved:
- H0: The time series is regarded as non-stationary. In simple words, we can say that it follows a time-dependent structure to some extent and doesn’t follow the constant variance over a period of time.
- HA: The time series is regarded as stationary.
Now, if the p-value from this test comes out to be less than a particular level (e.g. α = 0.05) then in such cases we can reject the null hypothesis and come to the conclusion that the time series is stationary.
This article focuses upon how we can perform an Augmented Dickey-Fuller Test in R. Performing Augmented Dickey-Fuller Test in R is a step-by-step process and these steps are explained below.
Step 1: Let us create a time series data.
R
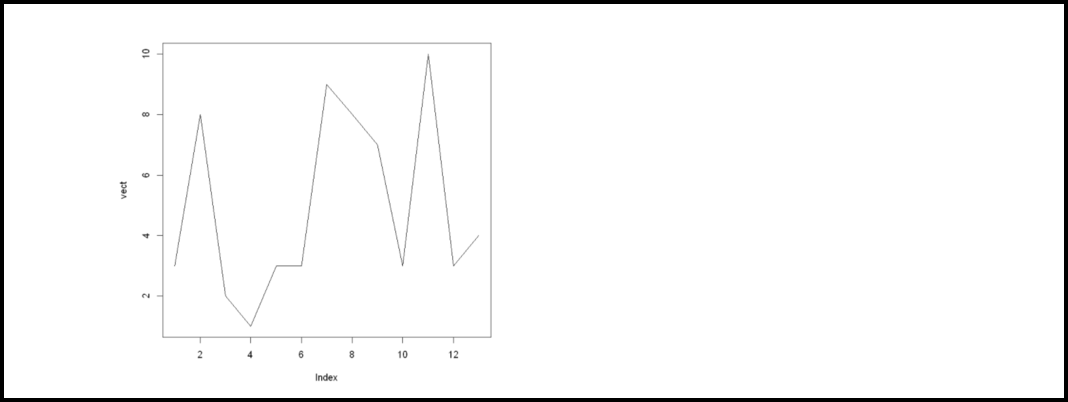
vect <- c(3, 8, 2, 1, 3, 3, 9, 8, 7, 3, 10, 3, 4)
|
Step 2: Visualize the data:
Before we can actually perform the Augmented Dickey-Fuller Test, let’s create a plot and visualize the created data.
R
vect <- c(3, 8, 2, 1, 3, 3, 9, 8, 7, 3, 10, 3, 4)
plot(vect, type='l')
|
Output:
Step 3: Performing Augmented Dickey-Fuller test.
Now we will perform the Augmented Dickey-Fuller test. tseries library in R provides us adf.test() function using which we can conduct the test easily. The syntax of this function is given below,
Syntax:
adf.test(vect)
Parameter:
Here, vect is a numeric vector
Example:
R
library(tseries)
vect <- c(3, 8, 2, 1, 3, 3, 9, 8, 7, 3,10, 3, 4)
adf.test(vect)
|
Output:

Augmented Dickey-Fuller test
Interpretation:
The test statistic and p-value come out to be equal to -1.6846 and 0.6925 respectively. Since the p-value is equal to or greater than 0.05, hence we would fail to reject the null hypothesis. It implies that the time series is non-stationary. In simple words, we can say that it possesses some time-dependent structure and does not possess constant variance over time.
Like Article
Suggest improvement
Share your thoughts in the comments
Please Login to comment...