How to move or position a legend in ggplot2?
Last Updated :
06 Jun, 2021
In this article, we will discuss how to control a legend position in ggplot using an R programming language. To draw a legend within ggplot the parameter col is used, it basically adds colors to the plot and these colors are used to differentiate between different plots. To depict what each color represents a legend is produced by ggplot. col attribute can be specified in 2 places.
Simply specifying on basis of which attribute colors should be differentiated to the col attribute within ggplot() will get the job done.
Syntax: ggplot(df, aes(x, y, col=”name of the column to differentiate on the basis of”))
Code:
R
library("ggplot2")
function1 <- function(x){x**2}
function2 <- function(x){x**3}
function3 <- function(x){x/2}
function4 <- function(x){2*(x**3)+(x**2)-(x/2)}
df=data.frame(x = -2:2,
values=c(function1(-2 : 2),
function2(-2 : 2),
function3(-2 : 2),
function4(-2 : 2)),
fun=rep(c("function1", "function2",
"function3","function4"))
)
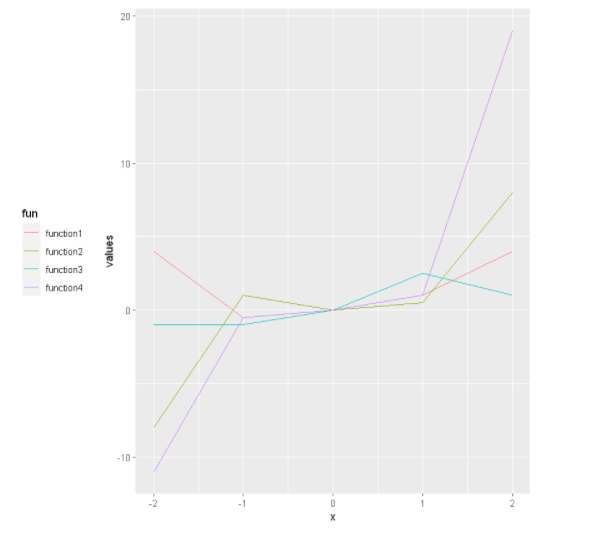
plot = ggplot(df,aes(x,values,col=fun))+geom_line()
plot
|
Output:
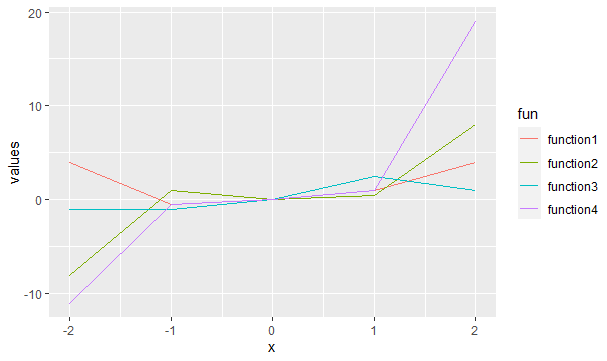
Now, we will see How to move or change position of ggplot2 Legend like at Top, Bottom and left. For Moving the position of ggplot2 legend at any side of the plot, we simply add the theme() function to geom_point() function.
Syntax : theme(legend.position)
Parameter : In General, theme() function has many parameters to specify the theme of the plot but here we use only legend.position parameter which specify the position of Legend.
Return : Theme of the plot.
We can specify the value of legend.position parameter as left, right, top and bottom to draw legend at left, right, top and bottom side of plot respectively.
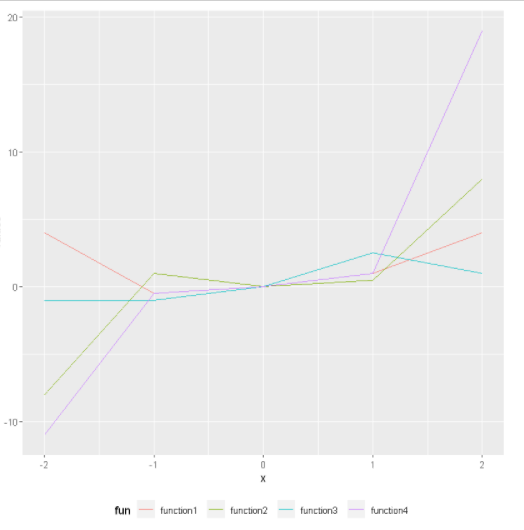
Bottom position:
Here we will change the position of the legend at the bottom of the plot diagram.
Syntax: theme(legend.position = “bottom”)
Code:
Python3
plot + theme(legend.position = "bottom")
|
Output:
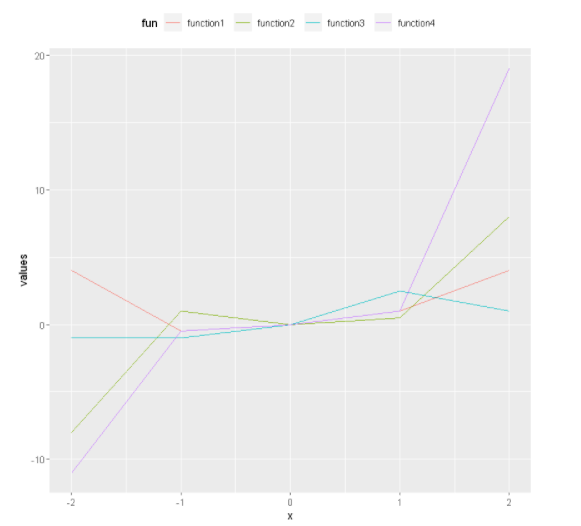
Top position:
Here we will change the position of the legend at the top of the plot diagram.
Syntax: theme(legend.position = “top”)
Code:
Python3
plot + theme(legend.position = "top")
|
Output:
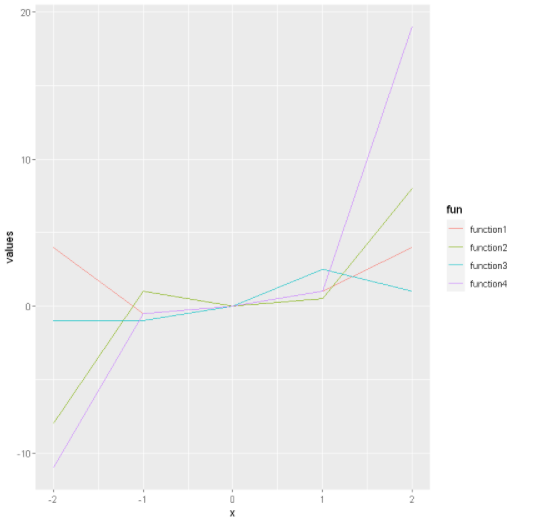
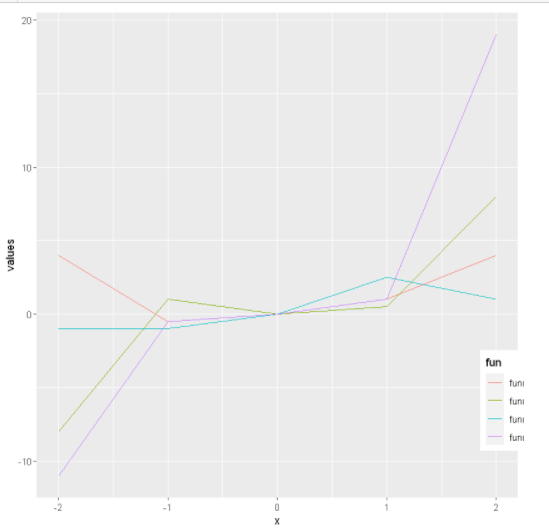
Right position:
Here we will change the position of the legend to the right of the plot diagram.
Syntax: theme(legend.position = “right”)
Code:
Python3
plot + theme(legend.position = "right")
|
Output:
Left position:
Here we will change the position of the legend to the left of the plot diagram.
Syntax: theme(legend.position = “left”)
Code:
Python3
plot + theme(legend.position = "left")
|
Output:
Position at X and Y coordinates:
Here we can use a numeric vector to plotting the legend. It basically works on X, Y coordinates, the value should be 0 to 1.
Syntax: theme(legend.position = c(x, y))
Code:
Python3
plot + theme(legend.position = c(1, 0.2))
|
Output
Like Article
Suggest improvement
Share your thoughts in the comments
Please Login to comment...