How to Match a Template in MATLAB?
Last Updated :
30 Nov, 2022
Moving the template across the entire image and comparing it to the image’s covered window is a process known as “template matching.” The implementation of template matching involves two-dimensional convolution. Template matching has different applications and is utilized in such fields as face acknowledgment (see facial acknowledgment framework) and clinical picture handling. In the past, methods for counting the number of people who cross a portion of a bridge within a predetermined amount of time have been developed and implemented.
Template Matching in MATLAB:
To compare two images, the correlation coefficient is utilized. The correlation coefficient, which typically falls between -1 and 1, is a term used to describe the quantitative measure of the degree of association between two distinct variables.
Syntax:
Tmatcher = vision.Templatematcher
Tmatcher = vision.Templatematcher(Name,Value)
- Tmatcher = vision.Templatematcher returns the object Tmatcher, a template matcher. By moving a template around an image’s interior in single-pixel steps, this object performs template matching.
- Tmatcher = vision.Templatematcher(Name,Value) Using one or more name-value pairs, properties are set. Put quotes around the names of each property. Tmatcher, for instance, equals vision. “Metric” and “Sum of absolute differences” in Templatematcher
Example 1:
Matlab
X1 = imread('GeeksforGeeks.jpg');
Y1 = imread('GFG LOGO.jpg');
X = X1(:,:,1);
Y = Y1(:,:,1);
normx_corrmap=normxcorr2(Y(:,:,1),X(:,:,1));
maxptx = max(normx_corrmap(:));
[a1,b1]=find(normx_corrmap==maxptx);
imagesc(X1(a1-size(Y,1):a1,b1-size(Y,2):b1,:));
|
Matching Templates in the Spatial Domain:
Matlab
X1 = imread('GeeksforGeeks.jpg');
Y1 = imread('GFG LOGO.jpg');
X = X1(:,:,1);
Y = Y1(:,:,1);
corr_map = zeros([size(X,1),size(X,2)]);
for i = 1:size(X,1)-size(Y,1)
for j = 1:size(X,2)-size(Y,2)
corr_map(i,j) = corr2(X(i:i+size(Y,1)-1,j:j+size(Y,2)-1),Y);
end
end
figure,images(corr_map);colorbar;
maxpt = max(corr_map(:));
[a,b]=find(corr_map==maxpt);
figure,imagesc(Y1);title('Target Image');
colormap(gray);
grayX = rgb2gray(X1);
Res = X;
Res(:,:,1)=grayX;
Res(:,:,2)=grayX;
Res(:,:,3)=grayX;
Res(a:a+size(Y,1)-1,
b:b+size(Y,2)-1,:)
=X1(a:a+size(Y,1)-1,
b:b+size(Y,2)-1,:);
figure,imagesc(Res);
|
Output:

Template image

Target image
Explanation:
The correlation coefficient is determined using the MATLAB command “corr2.”The correlation map is created by overlaying the Target Image on the template image and determining the correlation coefficient for each pixel in the template image.The map is used to determine the maximum coefficient after sliding through all of the image’s pixels. The target image’s starting point is the pixel position with the highest value.
Example 2:
Matlab
A1 = imread('Object.jpg');
B1 = imread('Balls.jpg');
A = A1(:,:,1);
B = B1(:,:,1);
normx_corrmap=normxcorr2(B(:,:,1),A(:,:,1));
maxptx = max(normx_corrmap(:));
[x1,y1]=find(normx_corrmap==maxptx);
figure,
imagesc(A1(x1-size(B,1):x1,y1-size(B,2):y1,:));
|
Matching Templates in the Spatial Domain:
Matlab
A1 = imread('Object.jpg');
B1 = imread('Balls.jpg');
A = A1(:,:,1);
B = B1(:,:,1);
corr_map = zeros([size(A,1),size(A,2)]);
for i = 1:size(A,1)-size(B,1)
for j = 1:size(A,2)-size(B,2)
corr_map(i,j) = corr2(A(i:i+size(B,1)-1,j:j+size(B,2)-1),B);
end
end
figure,images(corr_map);colorbar;
maxpt = max(corr_map(:));
[x,y]=find(corr_map==maxpt);
figure,imagesc(B1);title('Target Image');colormap(gray);
grayA = rgb2gray(A1);
Res= A;
Res(:,:,1)=grayA;
Res(:,:,2)=grayA;
Res(:,:,3)=grayA;
Res(x:x+size(B,1)-1,y:y+size(B,2)-1,:)
=A1(x:x+size(B,1)-1,y:y+size(B,2)-1,:);
figure,imagesc(Res);
|
Output:

Template image
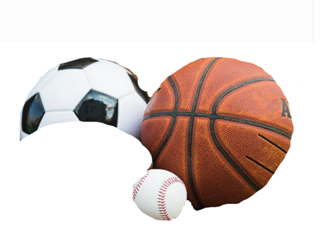
Target image
Explanation:
The MATLAB command “corr2” can be used to calculate the correlation coefficient. By overlaying the target image on the template image and computing the correlation coefficient for each pixel in the template image, the correlation map is produced. After sliding through each and every pixel of the image, the map is used to calculate the maximum coefficient. The pixel position with the highest value serves as the starting point for the target image.
Like Article
Suggest improvement
Share your thoughts in the comments
Please Login to comment...