How to make legend key fill transparent in ggplot2 in R?
Last Updated :
30 Jun, 2021
In this article, we will see how to make legend key fill transparent in ggplot2 in R Programming Language.
Note: Here we will be using a line graph, the same can be applied to any other plot.
Let us first draw a regular plot, so that the difference is apparent.
Example:
R
library("ggplot2")
DF <- data.frame(X = rnorm(50),
Y = rnorm(50),
Users = c("User1", "User2", "User3",
"User4", "User5"))
ggplot(DF,aes(X, Y, color = Users))+
geom_line(size = 1)
|
Output:
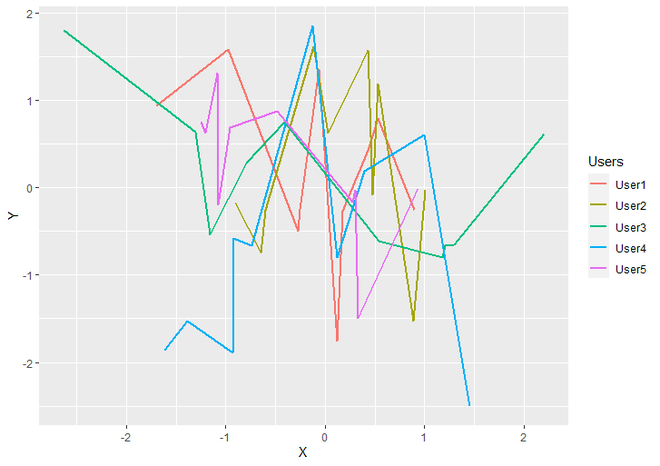
LineGraph with Default Legend Keys
As you can see clearly in the above plot, Legend Keys have a grey background. So now we are going to convert it into transparent by using theme() function. theme() in itself is a very big function containing lots of theme elements that we can apply to the plot for making our plot look presentable. To change the background of Legend keys, we use legend.key, which specifies the background underneath legend keys.
Syntax : theme(legend.key)
Parameter :
- legend.key : For specify background underneath legend keys. we assign element_rect function as the value of it.
Return : Theme Of the plot
Further, we specify the element_rect() function as a value of legend.key, which is often used for backgrounds and borders. It also has some parameters for customization such as fill, color, size, and linetype but here for make fill the Legend Keys with transparent background, we will use only fill parameter out of them.
Syntax : element_rect(fill)
Parameter :
return : Modifications on backgrounds and borders.
Syntax:
theme(legend.key = element_rect(fill))
Example:
R
library("ggplot2")
DF <- data.frame(X = rnorm(50),
Y = rnorm(50),
Users = c("User1", "User2", "User3",
"User4", "User5"))
ggplot(DF,aes(X, Y, color = Users))+
geom_line(size = 1)+
theme(legend.key = element_rect(fill = "transparent"))
|
Output:
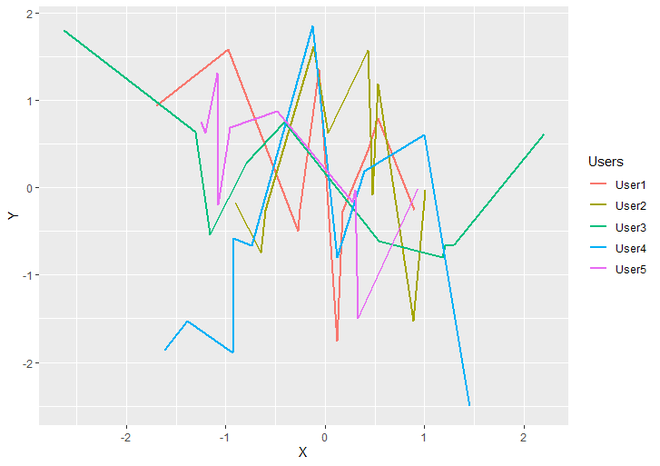
LineGraph with transparent filled Legend Keys
Like Article
Suggest improvement
Share your thoughts in the comments
Please Login to comment...