How to Make ECDF Plot with ggplot2 in R?
Last Updated :
18 Apr, 2023
Empirical Cumulative Distribution Function Plot (ECDF) helps us to visualize one or more distributions. ECDF plot is a great alternative for histograms and it has the ability to show the full range of data without the need for various parameters.
In this article, we will discuss how to draw an ECDF plot using the ggplot2 package of R Programming language. To draw an ECDF plot, we use the stat_ecdf() function of the ggplot2 package of R Language.
Syntax: ggplot( df, aes(x)) + stat_ecdf( geom, col )
Parameters:
- df : determines dataframe used to plot ECDF plot
- geom: determines the shape of plot, i.e., point, step,etc.
- col: determines the color of plot
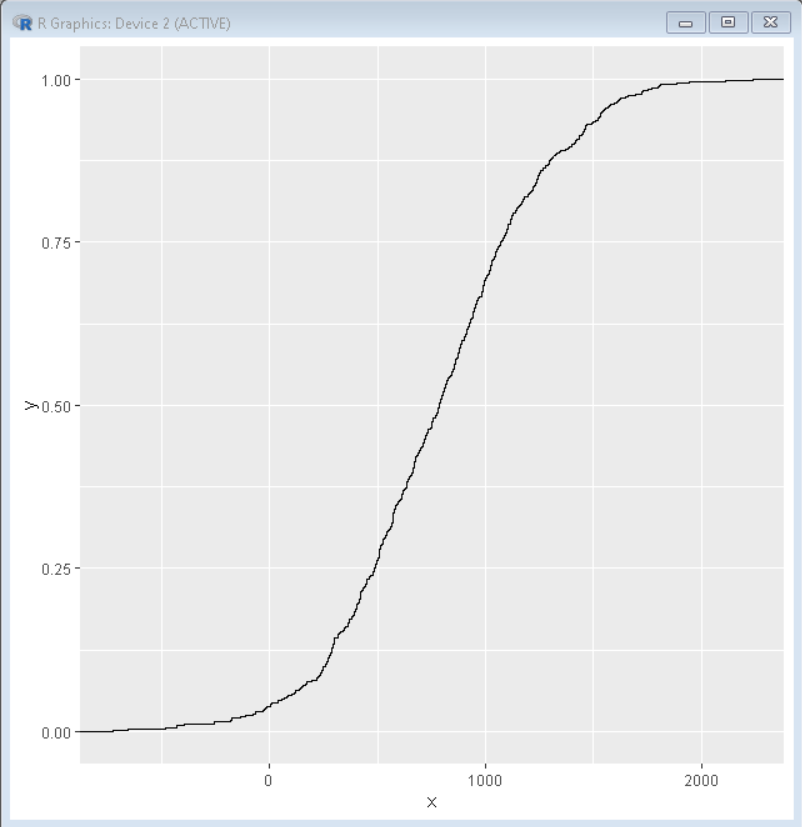
Create a basic ECDF plot
In this example, we will create a basic ECDF plot. We will use the ggplot() function and the stat_ecdf() function to plot the ECDF plot.
R
set.seed(1234)
sample_data <- data.frame(x = round(rnorm(700,
mean=800,
sd=450)))
library(ggplot2)
ggplot(sample_data, aes(x)) +
stat_ecdf()
|
Output:
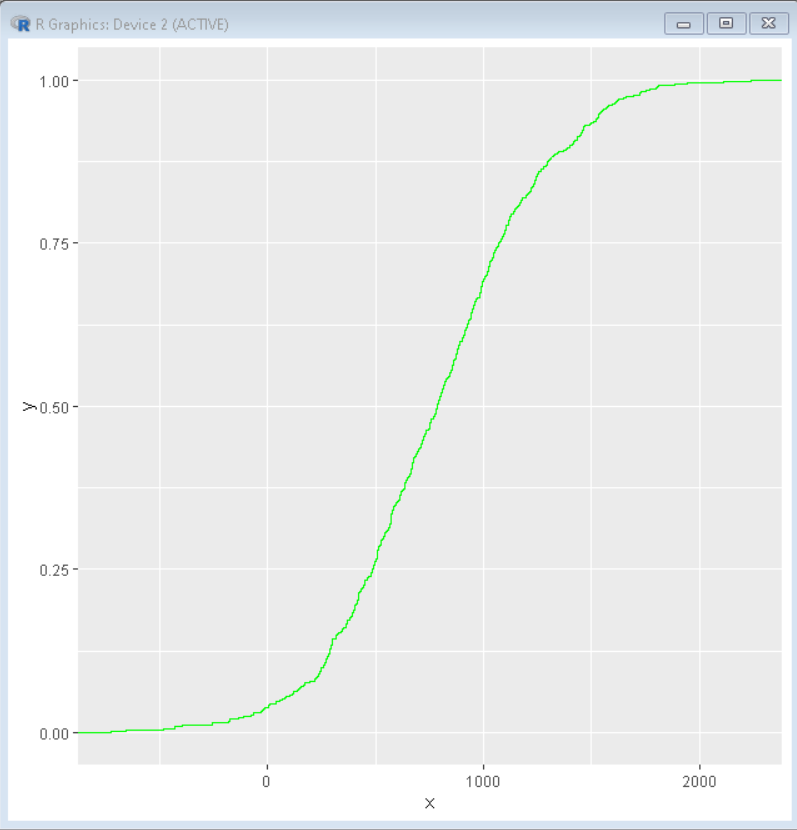
Color Customization
To change the color of the ECDF plot we use the col parameter of the stat_ecdf() function. We can add any color as the value of parameter col. We can even use hex codes of color. In this example, we have a green-colored ECDF plot made using stat_ecdf() function with the col parameter being green.
R
set.seed(1234)
sample_data <- data.frame(x = round(rnorm(700, mean=800,
sd=450)))
library(ggplot2)
ggplot(sample_data, aes(x)) +
stat_ecdf(col="green")
|
Output:
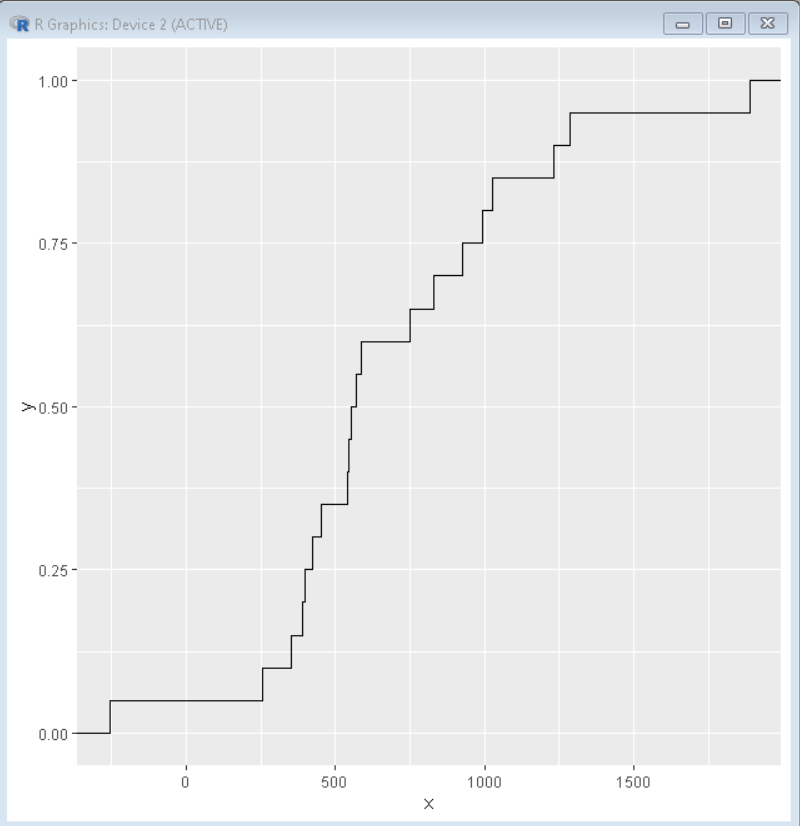
Shape Customization
To change the shape of the ECDF plot we use the geom parameter of the stat_ecdf() function. We can add any shape as the value of parameter geom. In this example, we have a stair-shaped ECDF plot made using stat_ecdf() function with the geom parameter being “step”.
R
set.seed(1234)
sample_data <- data.frame(x = round(rnorm(20, mean=800, sd=450)))
library(ggplot2)
ggplot(sample_data, aes(x)) +
stat_ecdf(geom="step")
|
Output:
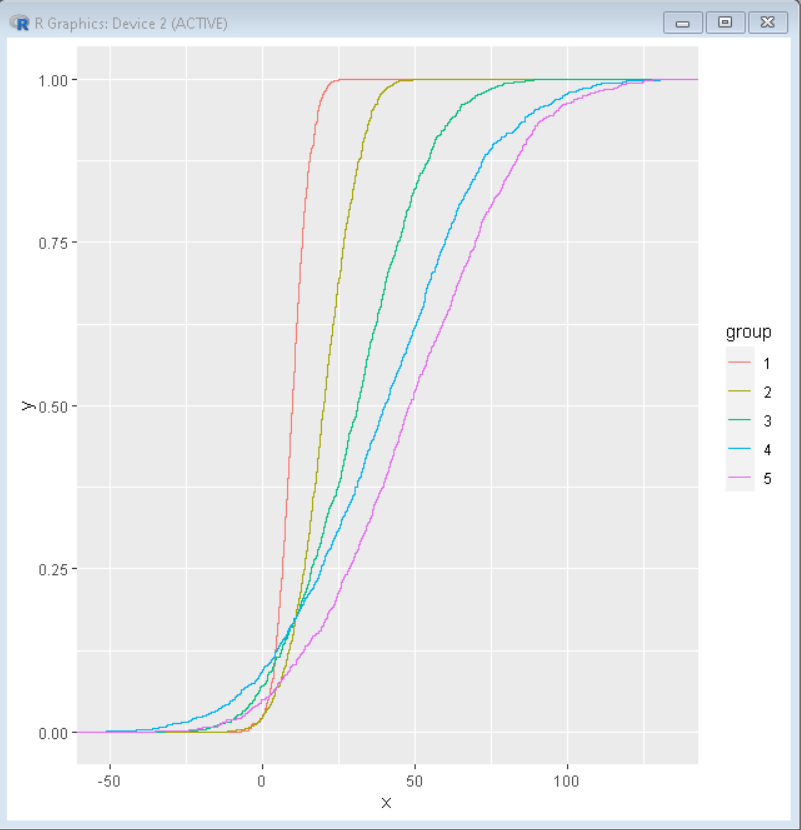
Multiple ECDF colored by group:
ECDF plot can be used for plotting multiple distributions. To plot multiple ECDF plots, we firstly create a multi-dimension dataset and then use the col parameter of the aes() function to color them according to the group.
Here, is a multiple distribution ECDF plots plotted with color by group using col parameter of the aes() function of the ggplot2 package. To create a multi-dimension dataset we will use rnorm() functions with gl() function to group them in 5 columns of size 1000.
R
set.seed(1234)
sample_data <- data.frame(x = c(rnorm(1000, 10, 5),
rnorm(1000, 20, 10),
rnorm(1000, 30, 20),
rnorm(1000, 40, 30),
rnorm(1000, 50, 30)),
group = gl(5, 1000))
library(ggplot2)
ggplot(sample_data, aes(x=x, col=group)) +
stat_ecdf()
|
Output:
Like Article
Suggest improvement
Share your thoughts in the comments
Please Login to comment...