How to Make Boxplots with Data Points using Seaborn in Python?
Last Updated :
03 Jan, 2021
Prerequisites :
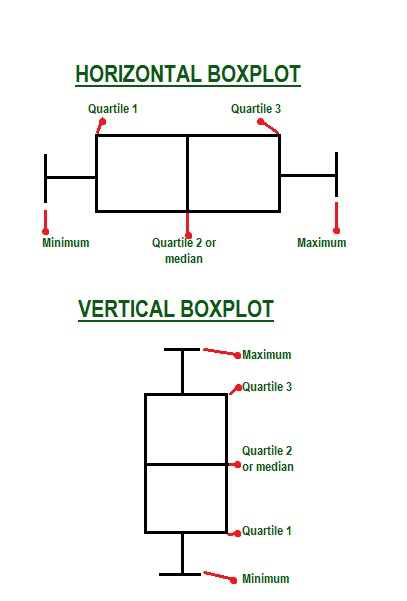
Box Plot or a Whisker Plot is a statistical plot to visualize graphically, depicting group of numerical data through their quartiles. This plot displays the summary of set of data containing the five values known as minimum, quartile 1, quartile 2 or median, quartile 3 and maximum, where the box is drawn from first quartile to third quartile.
A generic box plot mainly focuses on the five elements mentioned above to give the user a quartile based interpretation of the data, but it is possible to show data points on the box plot itself, making it more informative. For this seaborn is equipped with stripplot() function, all we have to do is call it just after boxplot() function with appropriate parameters to generate a boxplot with data points.
A strip plot is drawn on its own. It is a good complement to a boxplot or violinplot in cases where all observations are shown along with some representation of the underlying distribution. It is used to draw a scatter plot based on the category.
Syntax: seaborn.stripplot(*, x=None, y=None, hue=None, data=None, order=None, hue_order=None, jitter=True, dodge=False, orient=None, color=None, palette=None, size=5, edgecolor=’gray’, linewidth=0, ax=None, **kwargs)
Parameters:
- x, y, hue: Inputs for plotting long-form data.
- data: Dataset for plotting.
- order: It is the order to plot the categorical levels in.
- color: It is the color for all of the elements, or seed for a gradient palette
Returns: This method returns the Axes object with the plot drawn onto it.
Approach:
- Import the library
- Create or load the dataset.
- Plot a boxplot using boxplot().
- Add data points using stripplot().
- Display plot.
Given below are few implementations to help you understand better
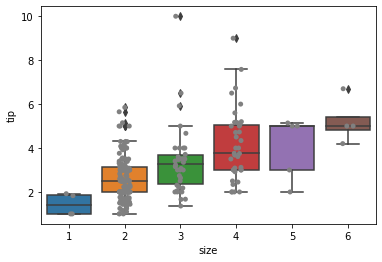
Example 1: Regular box plot for comparison
Python
import seaborn as sns
import matplotlib.pyplot as plt
tdata = sns.load_dataset('tips')
sns.boxplot(x='size', y='tip', data=tdata)
plt.show()
|
Output:

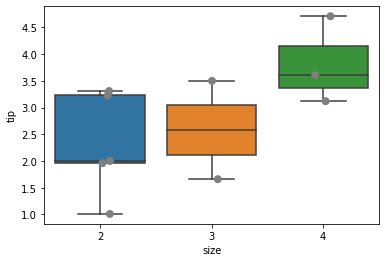
Example 2: Creating box plot with data points
Python
import seaborn as sns
import matplotlib.pyplot as plt
tdata = sns.load_dataset('tips')
sns.boxplot(x='size', y='tip', data=tdata)
sns.stripplot(x='size', y='tip', data=tdata)
plt.show()
|
Output:

Example 3: Boxplot with data points with non-default color
Python
import seaborn as sns
import matplotlib.pyplot as plt
tdata = sns.load_dataset('tips')
sns.boxplot(x='size', y='tip', data=tdata)
sns.stripplot(x='size', y='tip', data=tdata, color="grey")
plt.show()
|
Output:
Example 4: Changing size of the data points
Python
import seaborn as sns
import matplotlib.pyplot as plt
tdata = sns.load_dataset('tips')
tdata = tdata.head(10)
sns.boxplot(x='size', y='tip', data=tdata)
sns.stripplot(x='size', y='tip', data=tdata, color="grey", size=8)
plt.show()
|
Output:
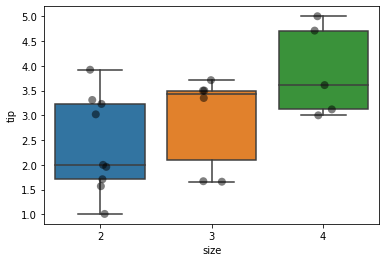
Example 5: Plotting transparent data points
Python
import seaborn as sns
import matplotlib.pyplot as plt
tdata = sns.load_dataset('tips')
tdata = tdata.head(20)
sns.boxplot(x='size', y='tip', data=tdata)
sns.stripplot(x='size', y='tip', data=tdata, color="black", size=8, alpha=0.5)
plt.show()
|
Output:
Like Article
Suggest improvement
Share your thoughts in the comments
Please Login to comment...