How to Make Boxplot with Jittered Data Points using Altair in Python?
Last Updated :
26 Nov, 2020
In this article, we will determine the way to form a boxplot with data points using Altair. The latest version of Altair supports making simple boxplots. However, the current version of Altair doesn’t support adding jittered data points on top of boxplots. Because of Justin Bois from Caltech, we will use his data visualization utility package Altair-catplot, we will make boxplots with jittered data points.
- Altair : Altair is a statistical visualization library in Python. It is declarative in nature and is based on Vega and Vega-Lite visualization grammars. It is fast becoming the first choice of people looking for a quick and efficient way to visualize datasets. If you have used imperative visualization libraries like matplotlib, you will be able to rightly appreciate the capabilities of Altair.
- Catplot : Catplot is a relatively new addition to Seaborn that simplifies plotting that involves categorical variables. In Seaborn version v0. 9.0 that came out in July 2018, changed the older factor plot to catplot to make it more consistent with terminology in pandas and in seaborn.
- Boxplot : We can create a box plot as follows. Note that the mark is a string specifying a box plot (as will be in the future with Altair), and the encoding is specified as a dictionary of key-value pairs.
Steps Required
- Import Libraries
- Import or create data
- Use altair_catplot.catplot() method with jitterbox transform.
- Modify the values of different attributes for better visualization (optional).
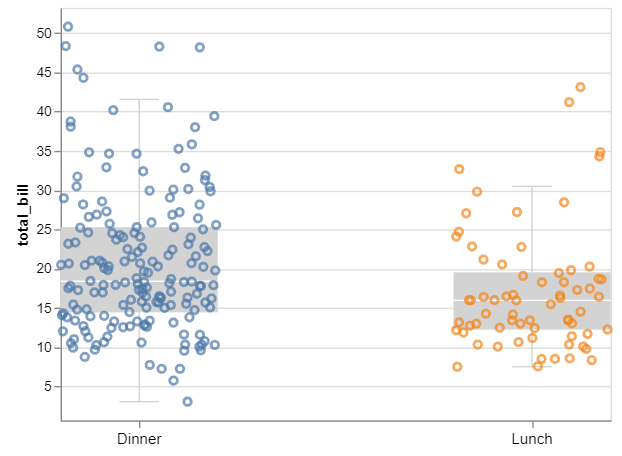
Example 1:
Python3
import altair
import altair_catplot
import seaborn
tip = seaborn.load_dataset('tips')
altair_catplot.catplot(tip,
transform ='jitterbox',
mark ='point',
encoding = dict(x = altair.X('time:N', title = None),
y = altair.Y('total_bill:Q', scale = altair.Scale(zero = False)),
color = altair.Color('time:N', legend = None))
)
|
Output:
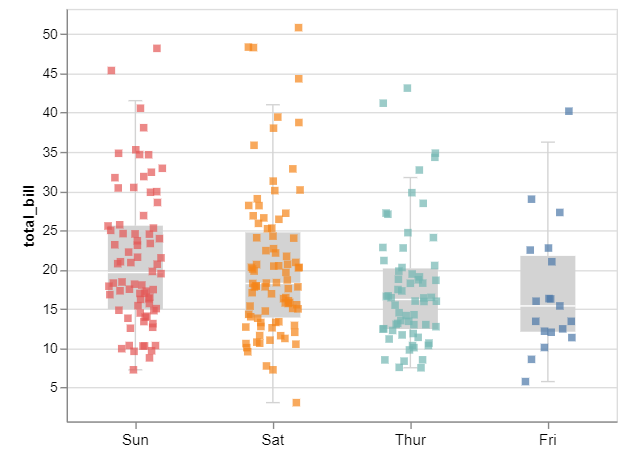
Example 2:
Python3
import altair
import altair_catplot
import seaborn
tip = seaborn.load_dataset('tips')
altair_catplot.catplot(tip,
transform ='jitterbox',
mark ='square',
encoding = dict(x = altair.X('day:N', title = None),
y = altair.Y('total_bill:Q', scale = altair.Scale(zero = False)),
color = altair.Color('day:N', legend = None))
)
|
Output:
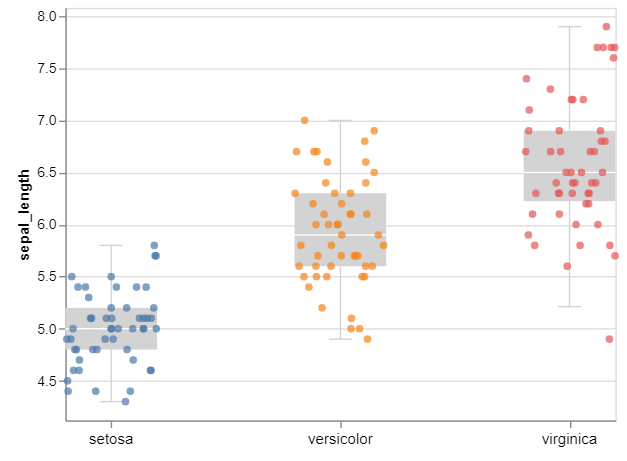
Example 3:
Python3
import altair
import altair_catplot
import seaborn
iris = seaborn.load_dataset('iris')
altair_catplot.catplot(iris,
transform ='jitterbox',
mark ='circle',
encoding = dict(x = altair.X('species:N', title = None),
y = altair.Y('sepal_length:Q', scale = altair.Scale(zero = False)),
color = altair.Color('species:N', legend = None))
)
|
Output:
Like Article
Suggest improvement
Share your thoughts in the comments
Please Login to comment...