How to limit the width and height in Pygal?
Last Updated :
24 Jan, 2021
Prerequisites: pygal
Pygal is a graphics and user interface library for Python that provides functionality commonly required in designing and science applications. While making a plot it is important for us to optimize its size. In this article, we will see how we can resize the plot window in the Pygal module. Here are various ways to change the default plot size as per our required dimensions or resize a given plot.
Approach:
- Import required module.
- Create a chart object.
- Pass width/height in function.
- Label the graph.
- Display Graph.
Implementation of the concept discussed above is given below:
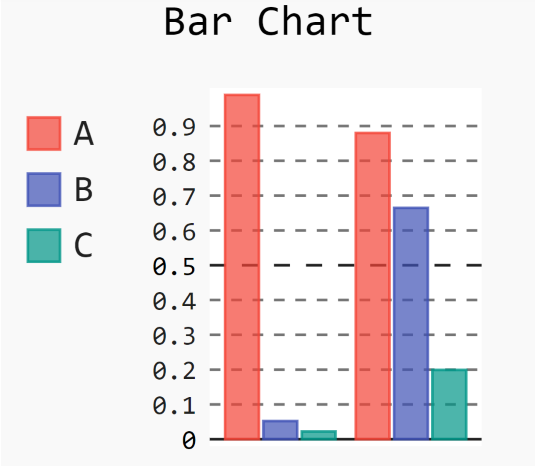
Example 1:
Python3
import pygal
import numpy
chart = pygal.Bar(width=200, height=200)
chart.title = 'Bar Chart'
chart.add('A', numpy.random.rand(2))
chart.add('B', numpy.random.rand(2))
chart.add('C', numpy.random.rand(2))
chart.render_to_png('img.png')
|
Output:
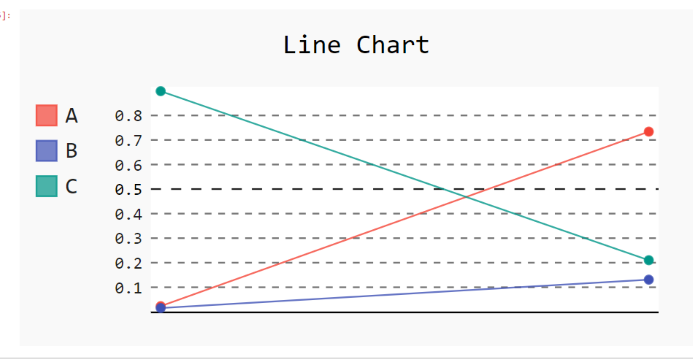
Example 2:
Python3
import pygal
import numpy
chart = pygal.Line(width=400, height=200)
chart.title = 'Line Chart'
chart.add('A', numpy.random.rand(2))
chart.add('B', numpy.random.rand(2))
chart.add('C', numpy.random.rand(2))
chart.render_to_png('img.png')
|
Output:
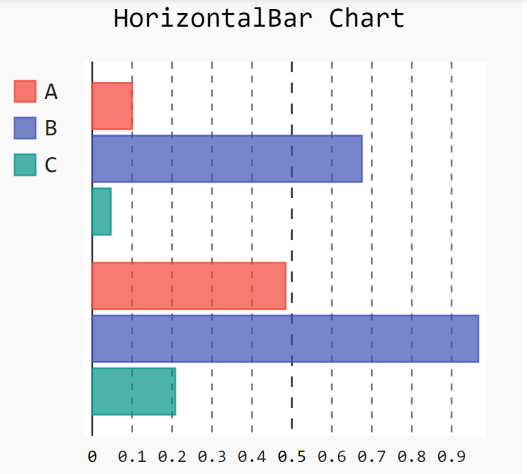
Example 3:
Python3
import pygal
import numpy
chart = pygal.HorizontalBar(width=300, height=300)
chart.title = 'HorizontalBar Chart'
chart.add('A', numpy.random.rand(2))
chart.add('B', numpy.random.rand(2))
chart.add('C', numpy.random.rand(2))
chart.render_to_png('img.png')
|
Output:
Like Article
Suggest improvement
Share your thoughts in the comments
Please Login to comment...