How to Install Seaborn on Linux?
Last Updated :
19 Nov, 2021
Seaborn is a library mostly used for statistical plotting in Python. It is built on top of Matplotlib and provides beautiful default styles and color palettes to make statistical plots more attractive.
Seaborn Dependencies:
Seaborn has the following dependencies:
- Python 3.4+
- numpy
- scipy
- pandas
- matplotlib
- pip
Installing Seaborn on Linux:
Use the below command in the terminal to install Seaborn:
pip install seaborn
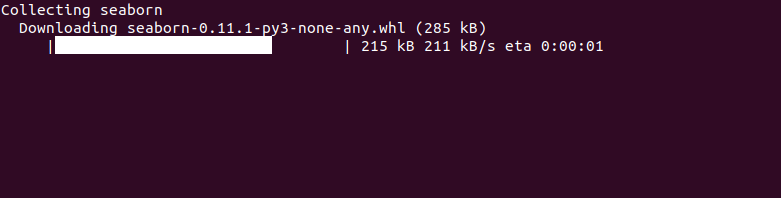
In the terminal, it will look like this:
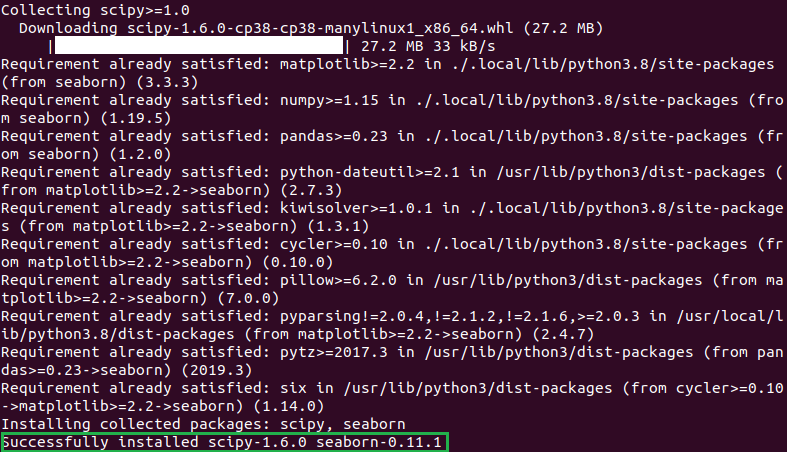
After the installation is completed you will get a successfully installed message at the end of the terminal as shown below:
After the installation let us see an example of a simple plot using Seaborn. We will be plotting a simple line plot using the iris dataset. Iris dataset contains five columns such as Petal Length, Petal Width, Sepal Length, Sepal Width, and Species Type. Iris is a flowering plant, the researchers have measured various features of the different iris flowers and recorded them digitally.
Example:
Python3
import seaborn as sns
data = sns.load_dataset("iris")
sns.lineplot(x="sepal_length", y="sepal_width", data=data)
|
Output:
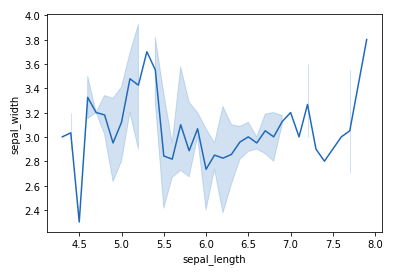
In the above example, a simple line plot is created using the lineplot() method.
Example 2: Plotting categorical scatter plots with Seaborn using Matplotlib.
Python3
import matplotlib.pyplot as plt
import seaborn as sns
x =['sun', 'mon', 'fri', 'sat', 'tue', 'wed', 'thu']
y =[5, 6.7, 4, 6, 2, 4.9, 1.8]
ax = sns.stripplot(x, y);
ax.set(xlabel ='Days', ylabel ='Amount_spend')
plt.title('My first graph');
plt.show()
|
Output:
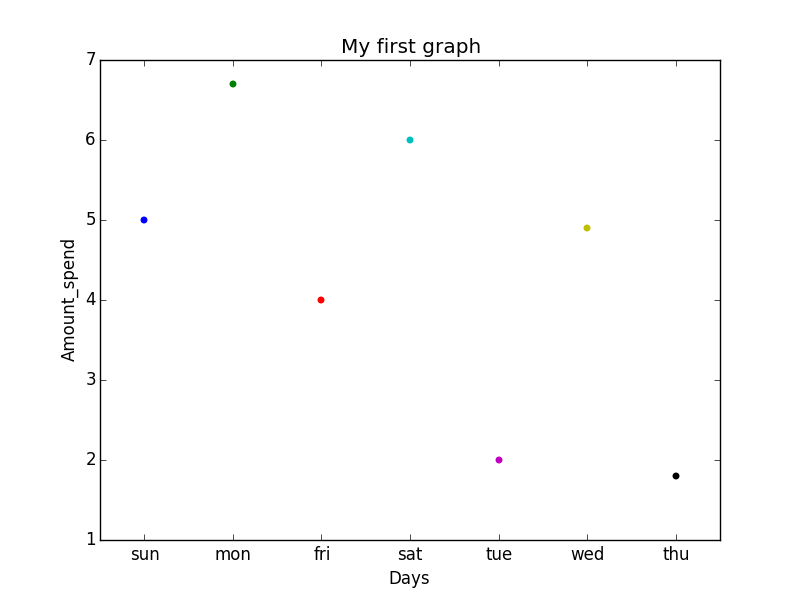
Here,
- Categorical data is represented on the x-axis and values correspond to them represented through the y-axis.
- .striplot() function is used to define the type of the plot and to plot them on canvas using.
- .set() function is used to set labels of x-axis and y-axis.
- .title() function is used to give a title to the graph.
- To view plot we use .show() function.
Like Article
Suggest improvement
Share your thoughts in the comments
Please Login to comment...