How to Install Matplotlib on Linux?
Last Updated :
29 Sep, 2022
Matplotlib is a low-level library of Python which is used for data visualization. It is easy to use and emulates MATLAB like graphs and visualization. This library is built on the top of NumPy arrays and consist of several plots like line chart, bar chart, histogram, etc. It provides a lot of flexibility but at the cost of writing more code.
Environment Setup:
Matplotlib is an overall package for creating static, animated, and interactive visualizations in Python. It literally opens up a whole new world of possibilities for you! Especially when it is used with Numpy or Pandas library, one can do unimaginable things. The plots give may give a new insight altogether. Now, the question arises i.e. How to make it running on your computer? But a more primary question would be, what are its pre-requisites or as we call it, dependencies for the software to run on your computer?
Dependencies:
- Python (>= 3.6)
- FreeType (>= 2.3)
- libpng (>= 1.2)
- NumPy (>= 1.11)
- setuptools
- cycler (>= 0.10.0)
- dateutil (>= 2.1)
- kiwisolver (>= 1.0.0)
- pyparsing
Installation on Linux:
We will use the pip command to install this module. If you do not have pip installed then refer to the article, Download and install pip Latest Version.
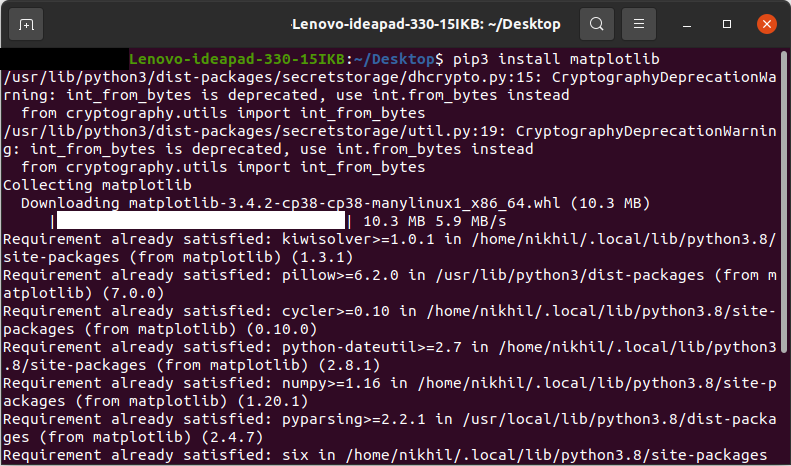
To install Matplotlib type the below command in the terminal:
pip install matplotlib
You will get the following message once the installation is complete:
Let’s see some examples of using matplotlib:
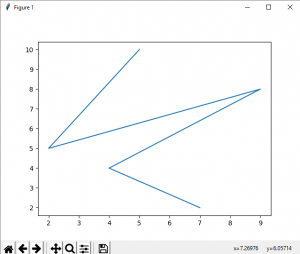
Example 1: Creating Line plots
Python3
from matplotlib import pyplot as plt
x = [5, 2, 9, 4, 7]
y = [10, 5, 8, 4, 2]
plt.plot(x,y)
plt.show()
|
Output:
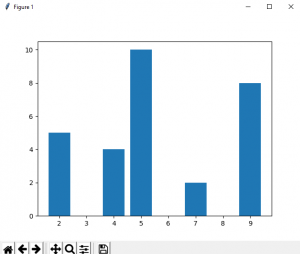
Example 2: Creating Bar plots
Python3
from matplotlib import pyplot as plt
x = [5, 2, 9, 4, 7]
y = [10, 5, 8, 4, 2]
plt.bar(x,y)
plt.show()
|
Output:
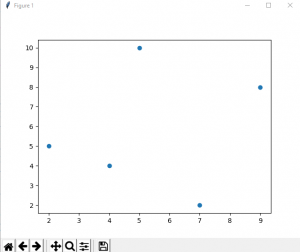
Example 3: Creating Scatter plots
Python3
from matplotlib import pyplot as plt
x = [5, 2, 9, 4, 7]
y = [10, 5, 8, 4, 2]
plt.scatter(x, y)
plt.show()
|
Output:
Like Article
Suggest improvement
Share your thoughts in the comments
Please Login to comment...