How to import excel file and find a specific column using Pandas?
Last Updated :
18 Dec, 2023
To read specific columns from an Excel file in Pandas, you have the flexibility to use either column indices or letters. This is achieved by setting the usecols argument, which can take a comma-separated string or a list containing column identifying letters or indices. In this article, we will learn how to import an Excel file into a data frame and find the specific column.
Creating a Sample DataFrame
Here, we are given the “Sample_data.xlsx” Excel file that we will use in our whole article.
Excel File Link: Link
Python3
import pandas as pd
df = pd.read_excel('Sample_data.xlsx')
df.head()
|
Output
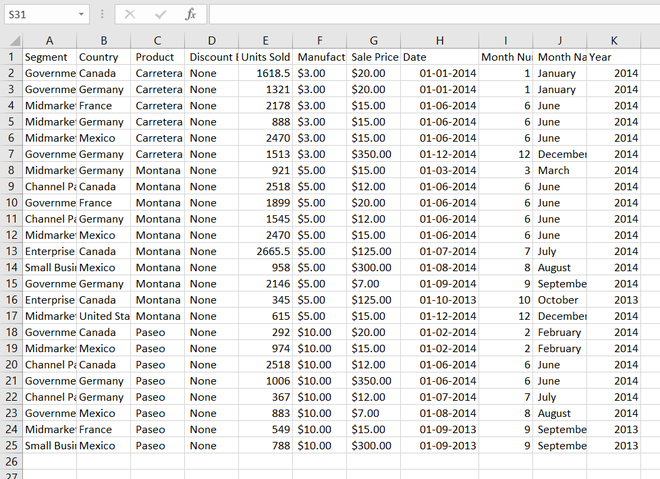
Sample_data.xlsx
Read Specific Column in Excel with Pandas
Below are some examples by which we can read specific column in Excel with Pandas in Python:
- Check and display specific column Using head()
- Reading specific columns from an Excel File in Pandas
- Selecting a range of columns from an Excel file in Pandas
- Selecting a range of columns and individual columns
- Selecting multiple ranges of columns from an Excel file in Pandas
- Read Specific Columns from an Excel file Using the range()
Check and Display Specific Column using head()
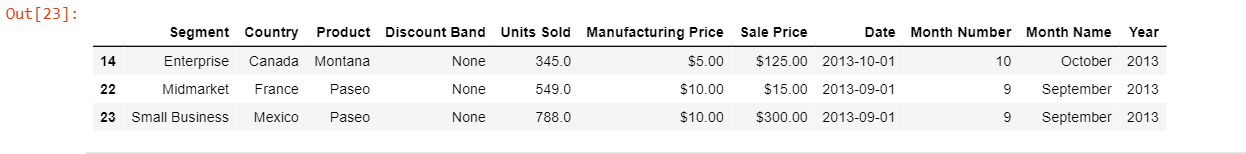
In this example, the code df[df["Country"] == 'Canada'].head() filters the Pandas DataFrame to display the first few rows where the “Country” column is equal to ‘Canada’. It retrieves entries specific to the country ‘Canada’ and presents a summary of the data.
Python3
df[df["Country"] == 'Canada'].head()
|
Output

Another column with the same methods.
Python3
df[df["Year"] == 2013].head()
|
Output
Another column with the same methods.
Python3
df[df["Segment"]=='Government'].head()
|
Output

Reading Specific Columns from an Excel File in Pandas
In this example, the code reads an Excel file, selecting and displaying specific columns (‘A’, ‘C’, ‘E’) using the usecols parameter. It prints a DataFrame containing only the specified columns from the Excel data.
Python3
specific_columns = pd.read_excel(file_path, usecols="A,C,E")
print(specific_columns)
|
Output
    Segment   Product  Units Sold
0  Government  Carretera       1618.5
1  Government  Carretera       1321.0
2   Midmarket  Carretera       2178.0
3   Midmarket  Carretera        888.0
4   Midmarket  Carretera       2470.0
5  Government  Carretera       1513.0
6   Midmarket    Montana        921.0
7  Channel Partners    Montana       2518.0
8  Government    Montana       1899.0
9  Channel Partners    Montana       1545.0
10  Midmarket    Montana       2470.0
Finding a Range of Columns from an Excel file in Pandas
In this example, the code reads an Excel file, extracting columns ‘A’ through ‘C’ inclusively using the usecols parameter. It then prints a DataFrame displaying the specified range of columns from the Excel data.
Python3
range_of_columns = pd.read_excel(file_path, usecols="A:C")
print(range_of_columns)
|
Output
    Segment Country   Product
0  Government  Canada  Carretera
1  Government  Germany  Carretera
2  Midmarket  France  Carretera
3  Midmarket  Germany  Carretera
4  Midmarket  Mexico  Carretera
5  Government  Germany  Carretera
6  Midmarket  Germany  Montana
7  Channel Partners  Canada  Montana
8  Government  France  Montana
9  Channel Partners  Germany  Montana
10  Midmarket  Mexico  Montana
Selecting a Range of Columns and Individual Columns
In this example, the code reads an Excel file, selecting columns ‘A’ through ‘C’ and column ‘E’. It then prints a DataFrame displaying the specified range and individual columns from the Excel data.
Python3
range_and_individual = pd.read_excel(file_path, usecols="A:C,E")
print(range_and_individual)
|
Output
    Segment   Product  Units Sold   Manufacturing Price
0  Government  Carretera       1618.5                   $3.00
1  Government  Carretera       1321.0                   $3.00
2   Midmarket  Carretera       2178.0                   $3.00
3   Midmarket  Carretera        888.0                   $3.00
4   Midmarket  Carretera       2470.0                   $3.00
5  Government  Carretera       1513.0                   $3.00
6   Midmarket    Montana        921.0                   $5.00
7  Channel Partners    Montana       2518.0                   $5.00
8  Government    Montana       1899.0                   $5.00
9  Channel Partners    Montana       1545.0                   $5.00
10  Midmarket    Montana       2470.0                   $5.00
Selecting Multiple Ranges of Columns from an Excel file in Pandas
In this example, the code reads an Excel file, selecting columns ‘A’ through ‘C’ and columns ‘E’ through ‘F’. It then prints a DataFrame displaying the specified multiple column ranges from the Excel data.
Python3
multiple_ranges = pd.read_excel(file_path, usecols="A:C,E:F")
print(multiple_ranges)
|
Output
           Segment     Product  Units Sold   Manufacturing Price Sale Price
0        Government   Carretera       1618.5                   $3.00      $20.00
1        Government   Carretera       1321.0                   $3.00      $20.00
2         Midmarket   Carretera       2178.0                   $3.00      $15.00
3         Midmarket   Carretera        888.0                   $3.00      $15.00
4         Midmarket   Carretera       2470.0                   $3.00      $15.00
5        Government   Carretera       1513.0                   $3.00      $350.00
6         Midmarket     Montana        921.0                   $5.00      $15.00
7  Channel Partners     Montana       2518.0                   $5.00      $12.00
8        Government     Montana       1899.0                   $5.00      $20.00
9  Channel Partners     Montana       1545.0                   $5.00      $12.00
10        Midmarket     Montana       2470.0                   $5.00      $15.00
Read Specific Columns from an Excel file Using the range() Class
In this example, the code utilizes the range() class to read specific columns from an Excel file. It reads columns at index 0 and 1, creating a DataFrame, and then prints the result, showcasing the selected columns.
Python3
range_class = pd.read_excel(file_path, usecols=range(0, 2))
print(range_class)
|
Output
           Segment  Country
0        Government   Canada
1        Government  Germany
2         Midmarket   France
3         Midmarket  Germany
4         Midmarket   Mexico
5        Government  Germany
6         Midmarket  Germany
7  Channel Partners   Canada
8        Government   France
9  Channel Partners  Germany
10        Midmarket   Mexico
Like Article
Suggest improvement
Share your thoughts in the comments
Please Login to comment...