How to Identify Slow Running Queries in SQL Server?
Last Updated :
18 Jul, 2022
Pre requisites: Introduction of MS SQL Server, Intro to SQL Server | Architecture
Microsoft SQL Server or MS SQL Server for short is the query language provided for data definition and manipulation. SQL Server is composed of: Database engine, and Relational engine, and Storage engine.
In this article, we will learn how to identify slow or lengthy queries that wind up consuming a lot of machine assets and consume most of the day to return results, whether because of exorbitant CPU, memory, or disk use.
The motivation behind this article is to help you in the identification of queries that have potential execution issues. When these queries are identified, you ought to then consider whether you want to add more resources to the machine or begin execution and query tuning exercises.
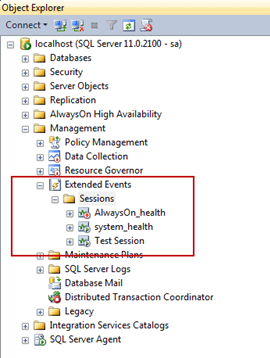
SQL Server Extended Events:
The SQL Profiler has been replaced by SQL Server Extended Events. Expanded Events works through Event Tracing (ETW). This has been the well-known way for all Microsoft-related advances to uncover analytic information. ETW gives considerably more adaptability.
Find Slow Queries With SQL DMVs:
One of the extraordinary highlights of SQL Server is the Dynamic Management Views (DMVs) that are all incorporated into it. There are many of them and they can give an abundance of data about a large number of topics.
There are a few DMVs that give information about query details, execution plans, ongoing queries, and many more. These can be utilized together to give a few astounding insights.
For instance, the query underneath can be utilized to track down the queries that use the most reads, writes, worker time (CPU), and so on.
Query:
SELECT TOP 10 SUBSTRING(qt.TEXT,
(qs.statement_start_offset/2)+1,
((CASE qs.statement_end_offset
WHEN -1 THEN DATALENGTH(qt.TEXT)
ELSE qs.statement_end_offset
END - qs.statement_start_offset)/2)+1) query,
qs.execution_count, qs.total_logical_reads,
qs.last_logical_reads, qs.total_logical_writes,
qs.last_logical_writes,
qs.total_worker_time, qs.last_worker_time,
qs.total_elapsed_time/1000000 total_elapsed_time_in_S,
qs.last_elapsed_time/1000000 last_elapsed_time_in_S,
Output:
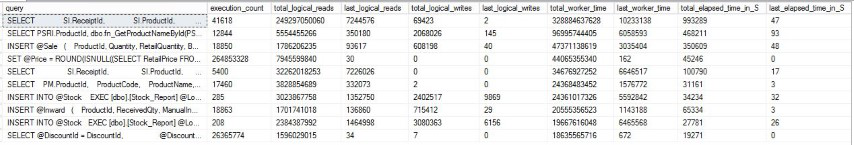
Here you can see that one specific query (the top one) takes up the most of the CPU.
By looking at this, we can duplicate that SQL query and check whether there is some way to further improve it, add an index, and so on.
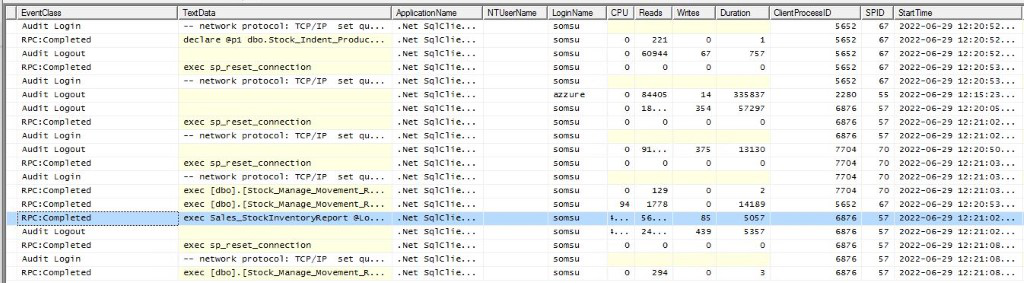
SQL Server Profiler:
The SQL Server Profiler has been around for quite a while. It is exceptionally valuable assuming you are attempting to find continuously the thing SQL queries are being executed against your database.
Note: Microsoft has announced that SQL Server Profiler is being deprecated!
SQL Profiler captures extremely detailed events about your interaction with SQL Server:
- Login connections, disconnections, and failures.
- Basic SQL statements like SELECT, INSERT, UPDATE, and DELETE.
- Begin and end stored procedures.
- Begin and end of statements inside a stored procedure.
- RPC batch status calls.
- Begin and end of a SQL batch.
- Errors are written the to SQL Server error log.
- An opened cursor.
- Security consent checks.
Like Article
Suggest improvement
Share your thoughts in the comments
Please Login to comment...