How to highlight text inside a plot created by ggplot2 using a box in R?
Last Updated :
18 Jul, 2021
In this article, we will discuss how to highlight text inside a plot created by ggplot2 using a box in R programming language.
There are many ways to do this, but we will be focusing on one of the ways. We will be using the geom_label function present in the ggplot2 package in R. This function allows us to create a rectangle underneath the text so that it becomes easier to read. We can also highlight our text inside the rectangular box and can also add other aesthetics of that text using this function. This can be achieved by a single line of code, therefore, it is easy and recommendable.
Syntax :
geom_label( mapping = NULL, data = NULL, stat = “identity”, position = “identity”, …., parse = FALSE, nudge_x = 0, nudge_y = 0, label.r = unit( 0.15, “lines”), label.padding = unit( 0.25, “lines”), label.size = 0.25, na.rm = FALSE, inherit.aes = TRUE, show.legend = NA)
The approach is simple and straightforward, call the geom_label() function and provide the following parameters – aesthetics of the text, label of the text, and fill argument to highlight the text inside the text label.
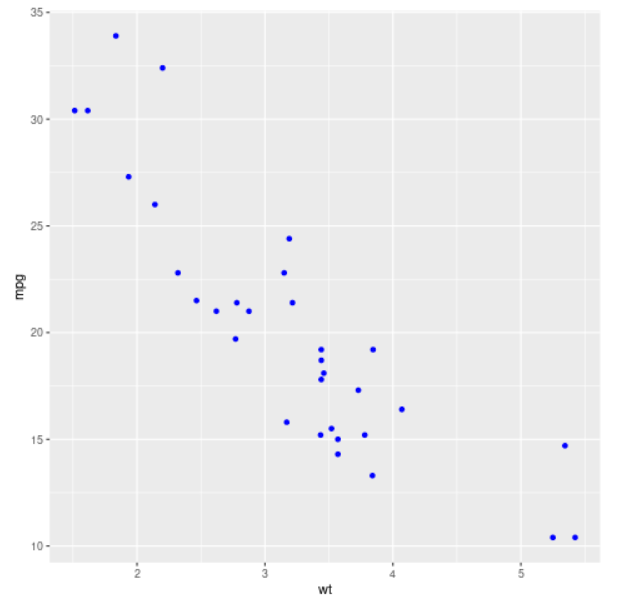
Example 1.1: Example to show regular plot so that the difference is apparent.
R
library(ggplot2)
data(mtcars)
head(mtcars)
ggplot(mtcars, aes(wt, mpg)) + geom_point(color="blue")
|
Output :
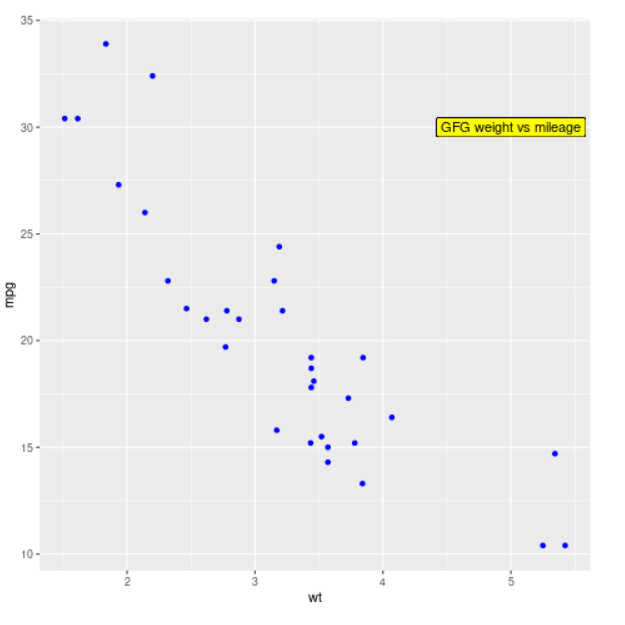
Now, we will add text and highlight it in our scatterplot using the geom_label function taking the aesthetics of the text such as x and y variables, label of the text, and color of the highlighted text inside the box as its arguments.
Example 1.2: Example to plot highlight text inside the plot
R
library(ggplot2)
data(mtcars)
head(mtcars)
ggplot(mtcars, aes(wt, mpg)) + geom_point(color="blue") +
geom_label(aes(x=5, y=30, label = "GFG weight vs mileage"),
fill= "yellow")
|
Output :
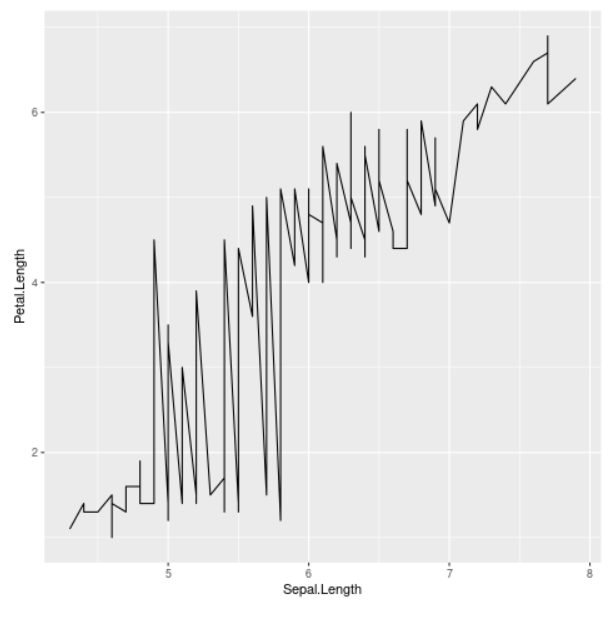
Let us see one more implementation.
Example 2.1: Regular plot, so that the difference is apparent
R
library(ggplot2)
data(iris)
head(iris)
ggplot(iris, aes(Sepal.Length, Petal.Length)) + geom_line()
|
Output :
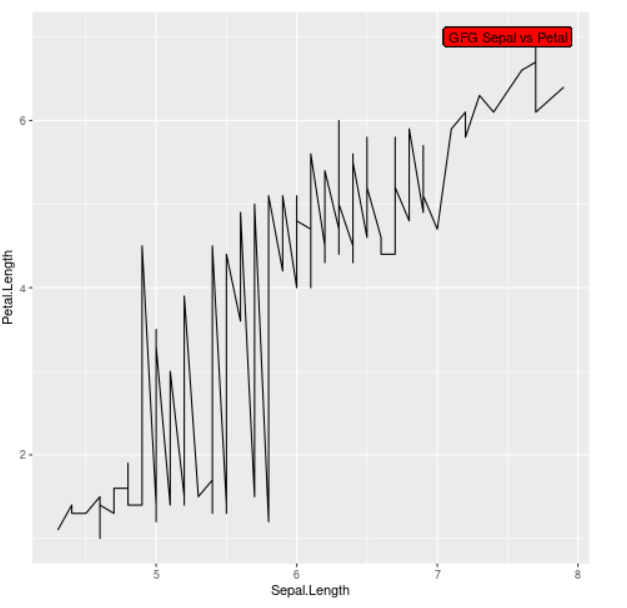
Now, we will add text and highlight it in our line plot using the geom_label function providing the aesthetics of the text as arguments.
Example 2.2: Example to plot highlight text inside the plot
R
library(ggplot2)
data(iris)
head(iris)
ggplot(iris, aes(Sepal.Length, Petal.Length)) + geom_line() +
geom_label(aes(x=7.5, y=7, label = "GFG Sepal vs Petal"),
fill= "red")
|
Output :
Like Article
Suggest improvement
Share your thoughts in the comments
Please Login to comment...