How to Highlight Groups with Convex Hull in ggplot2 in R?
Last Updated :
22 Feb, 2022
In this article, we are going to see how to highlight groups with the convex hull in ggplot2 using R Programming Language.
Convex hull polygon refers to the draw a line bounding box around the outermost points in each group.
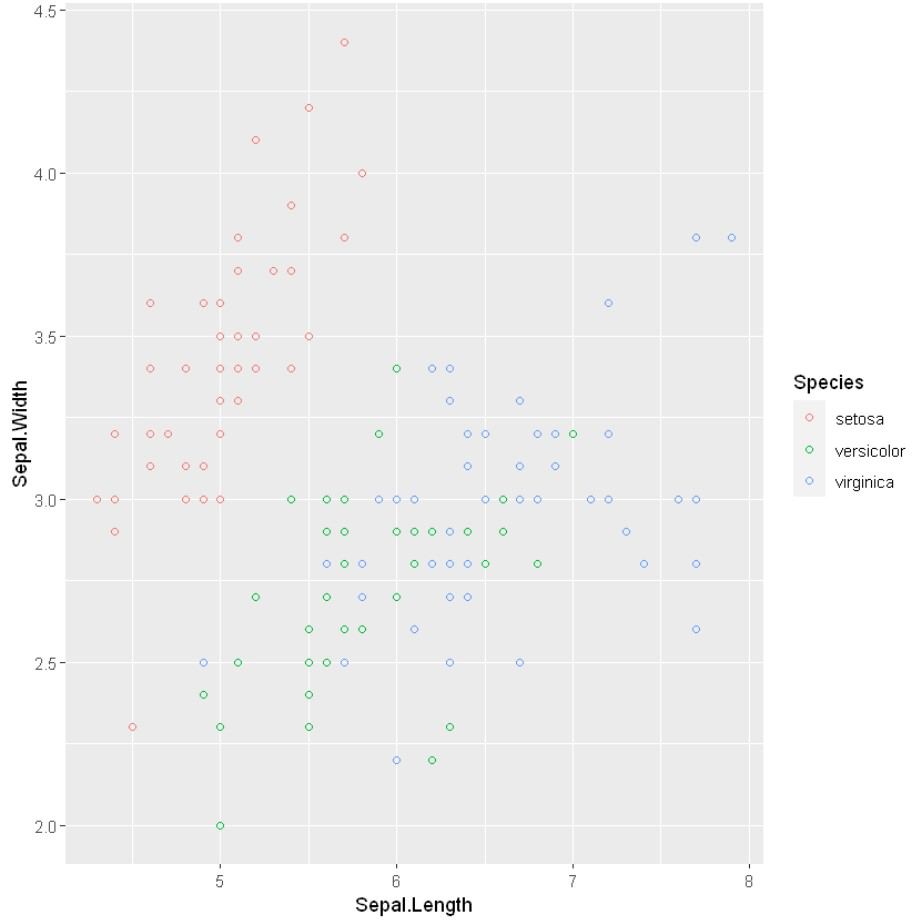
Creating scatterplot for demonstration
Here we will use the iris dataset to plot scatterplot along with two different groups(Sepal.Length and Sepal.Width). To plot the scatterplot we will use we will be using the geom_point() function. Following is brief information about ggplot function, geom_point().
Syntax : geom_point(size, color, fill, shape, stroke)
R
library(tidyverse)
plot <- ggplot(iris, aes(Sepal.Length,
Sepal.Width,
color = Species))+
geom_point(shape = 21)
plot
|
Output:
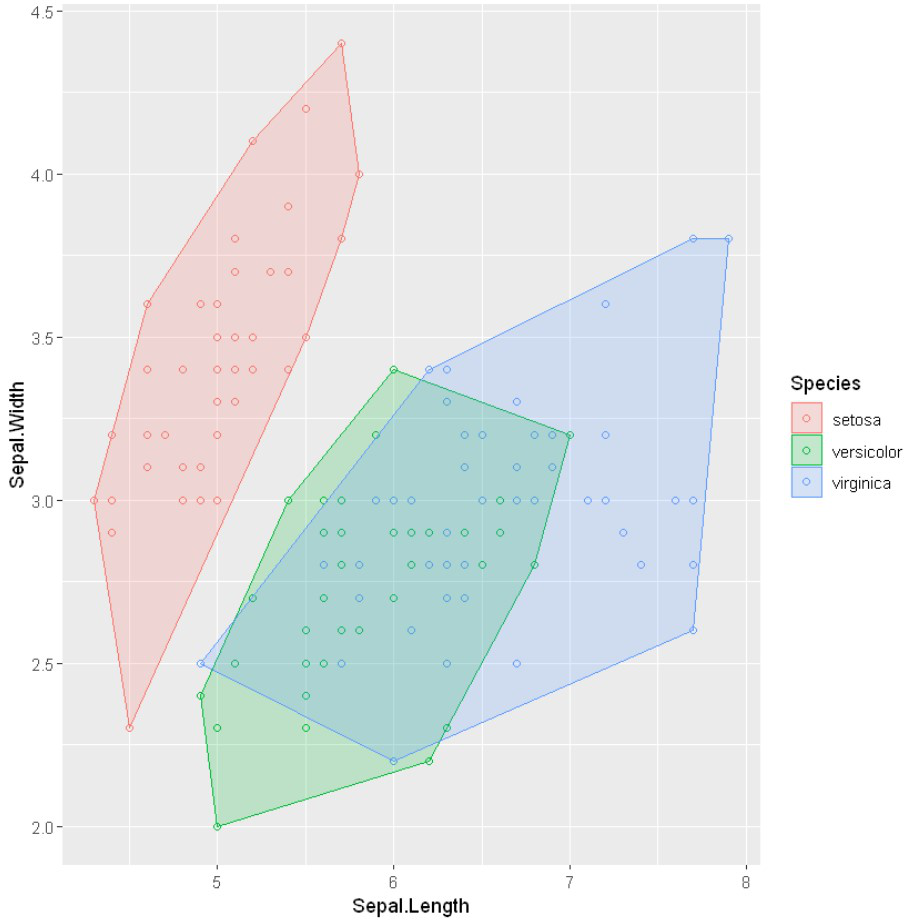
Highlight Groups with Convex Hull in ggplot2
To draw a line bounding box around the outermost points for each group we will use chull() method with grouped data points which computes the subset of points that lie on the convex hull of the set of points specified.
And to highlight the convex hull we can use geom_polygon() methods with convex hull datasets.
Syntax: geom_polygon( data, alpha, aes())
Parameters:
- data: Datasets
- alpha: Opacity of Points/Border
- aes: Color Highlight of data points.
R
hull <- iris %>% group_by(Species) %>%
slice(chull(Sepal.Length, Sepal.Width))
plot + geom_polygon(data = hull, alpha = 0.2,
aes(fill = Species,colour = Species))
|
Output:
Like Article
Suggest improvement
Share your thoughts in the comments
Please Login to comment...