How to generate random numbers from a log-normal distribution in Python ?
Last Updated :
07 Apr, 2021
A continuous probability distribution of a random variable whose logarithm is usually distributed is known as a log-normal (or lognormal) distribution in probability theory.
A variable x is said to follow a log-normal distribution if and only if the log(x) follows a normal distribution. The PDF is defined as follows.
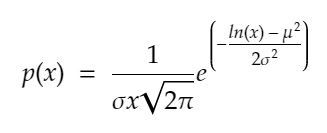
Probability Density function Log-normal
Where mu is the population mean & sigma is the standard deviation of the log-normal distribution of a variable. Just like normal distribution which is a manifestation of summation of a large number of Independent and identically distributed random variables, lognormal is the result of multiplying a large number of Independent and identically distributed random variables. Generating a random number from a log-normal distribution is very easy with help of the NumPy library.
Syntax:
numpy.random.lognormal(mean=0.0, sigma=1.0, size=None)
Parameter:
- mean: It takes the mean value for the underlying normal distribution.
- sigma: It takes only non-negative values for the standard deviation for the underlying normal distribution
- size : It takes either a int or a tuple of given shape. If a single value is passed it returns a single integer as result. If a tuple then it returns a 2D matrix of values from log-normal distribution.
Returns: Drawn samples from the parameterized log-normal distribution(nd Array or a scalar).
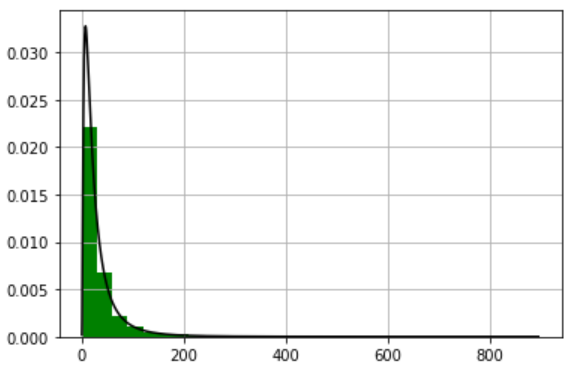
The below example depicts how to generate random numbers from a log-normal distribution:
Python3
import numpy as np
import matplotlib.pyplot as plt
mu, sigma = 3., 1.
s = np.random.lognormal(mu, sigma, 10000)
count, bins, ignored = plt.hist(s, 30,
density=True,
color='green')
x = np.linspace(min(bins),
max(bins), 10000)
pdf = (np.exp(-(np.log(x) - mu)**2 / (2 * sigma**2))
/ (x * sigma * np.sqrt(2 * np.pi)))
plt.plot(x, pdf, color='black')
plt.grid()
plt.show()
|
Output:
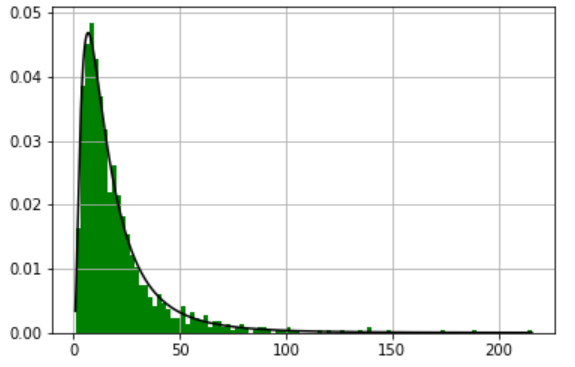
Let’s prove that log-Normal is a product of independent and identical distributions of a random variable using python. In the program below we are generating 1000 points randomly from a normal distribution and then taking the product of them and finally plotting it to get a log-normal distribution.
Python3
import numpy as np
import matplotlib.pyplot as plt
b = []
for i in range(1000):
a = 12. + np.random.standard_normal(100)
b.append(np.product(a))
b = np.array(b) / np.min(b)
count, bins, ignored = plt.hist(b, 100,
density=True,
color='green')
sigma = np.std(np.log(b))
mu = np.mean(np.log(b))
x = np.linspace(min(bins), max(bins), 10000)
pdf = (np.exp(-(np.log(x) - mu)**2 / (2 * sigma**2))
/ (x * sigma * np.sqrt(2 * np.pi)))
plt.plot(x, pdf,color='black')
plt.grid()
plt.show()
|
Output:
Share your thoughts in the comments
Please Login to comment...