How to generate Narrowband and Wideband FM signal using GNU-Octave?
Last Updated :
09 Jul, 2021
In this article, we are going to discuss how to generate the Narrowband and Wideband FM signal using MATLAB.
Frequency Modulation popularly known as FM is a kind of analog modulation technique in which the frequency of the high-frequency carrier signal is varied according to the amplitude of the modulating (message) signal while the amplitude and the phase of the carrier signal remain constant or unchanged.
Standard equation of an FM signal

where; fm = FM signal,
Ac = Amplitude of carrier signal,
fc = Carrier Frequency,
fm = Modulating Frequency,
t = time, & b = Frequency modulation index.
FM signals are classified into two broad categories depending upon the value of the frequency modulation index (b):
Narrowband FM signal
In general, the FM signals which have their frequency modulation index (b<1) less than unity are called Narrowband FM signals. Usually, narrowband FM signals are used in low-cost two-way radio communication systems like a walkie-talkie.
To generate the narrowband FM signal, we will be using the standard equation of the FM signal and pass the value of the frequency modulation index (b) less than unity.
Example:
Matlab
clc;
clear all;
close all;
t = 0:0.001:1;
fm = 20;
fc = 250;
b = input("Enter the value of b (<1): ");
msg = sin(2*pi*fm*t);
crr = cos(2*pi*fc*t);
nb_fm = cos((2*pi*fc*t)+(b*sin(2*pi*fm*t)));
figure('Name','Narrowband FM Signal Generation');
subplot(3,1,1);
plot(t, msg, 'b', 'Linewidth', 1.5);
title('Message signal');
xlabel('Time')
ylabel('Amplitude')
grid on;
subplot(3,1,2);
plot(t, crr, 'r', 'Linewidth', 1.5);
title('Carrier signal');
xlabel('Time')
ylabel('Amplitude')
grid on;
subplot(3,1,3);
plot(t, nb_fm, 'g', 'Linewidth', 1.5);
title('Narrowband FM signal');
xlabel('Time')
ylabel('Amplitude')
grid on;
|
Output:
Enter the value of b (<1): 0.55
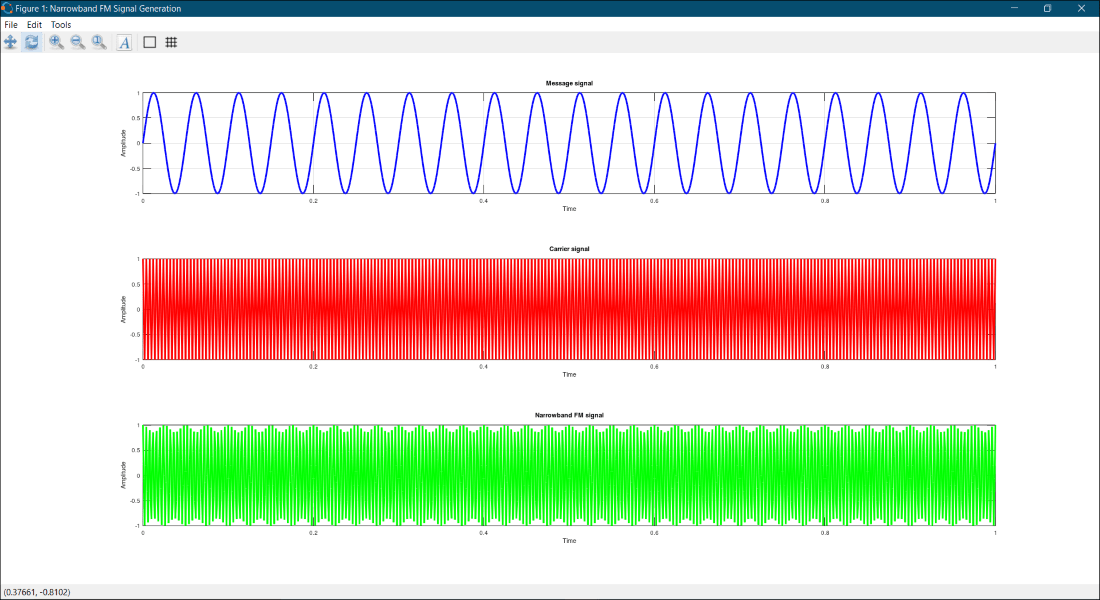
Output: Narrowband FM Signal Generation
Wideband FM signal
Unlike the narrowband FM signals, wideband FM signals are the FM signals whose frequency modulation index (b>1) is greater than unity. Normally, wideband signals are used for high-quality broadcast transmission.
To generate the wideband FM signal, we will be using the standard equation of the FM signal and pass the value of the frequency modulation index (b) greater than unity.
Example:
Matlab
clc;
clear all;
close all;
t = 0:0.001:1;
fm = 20;
fc = 250;
b = input("Enter the value of b (>1): ");
msg = sin(2*pi*fm*t);
crr = cos(2*pi*fc*t);
wb_fm = cos((2*pi*fc*t)+(b*sin(2*pi*fm*t)));
figure('Name','Wideband FM Signal Generation');
subplot(3,1,1);
plot(t, msg, 'b', 'Linewidth', 1.5);
title('Message signal');
xlabel('Time')
ylabel('Amplitude')
grid on;
subplot(3,1,2);
plot(t, crr, 'r', 'Linewidth', 1.5);
title('Carrier signal');
xlabel('Time')
ylabel('Amplitude')
grid on;
subplot(3,1,3);
plot(t, wb_fm, 'g', 'Linewidth', 1.5);
title('Wideband FM signal');
xlabel('Time')
ylabel('Amplitude')
grid on;
|
Output:
Enter the value of b (>1): 2.5

Output: Wideband FM Signal Generation
Like Article
Suggest improvement
Share your thoughts in the comments
Please Login to comment...