How to Fix: TypeError: no numeric data to plot
Last Updated :
28 Nov, 2021
In this article, we will fix the error: TypeError: no numeric data to plot
Cases of this error occurrence:
Python3
import pandas as pd
import numpy as np
import matplotlib.pyplot as plt
petal_length = ['3.3', '3.5', '4.0', '4.5',
'4.6', '5.0', '5.5', '6.0',
'6.5', '7.0']
petal_width = ['3.6', '3.8', '4.4', '6.6',
'6.8', '7.0', '7.5', '8.0',
'8.5', '8.9']
df = pd.DataFrame({'petal_length(cm)': petal_length,
'petal_width(cm)': petal_width})
df.plot(x='petal_length(cm)', y='petal_width(cm)')
plt.show()
|
Output:
TypeError: no numeric data to plot
Reason for the error :
Plotting can be done only on numeric data when we plot the data with datatype different that numeric data this error raises. To know whether the data types are numeric or not we can know it by using the function dtypes().
print(df.dtypes)
The data that we use to plot must be numeric.
Fixing the error:
This error can be fixed by converting the data to be plotted into numeric data. To convert the data to numeric data we can use the functions astype() or to_numeric().
Method 1 : Using astype() function
Syntax:
df['column_name']= df['column_name'].astype(data_type)
where, df is the input dataframe
Example:
Python3
import pandas as pd
import numpy as np
import matplotlib.pyplot as plt
petal_length = ['3.3', '3.5', '4.0', '4.5',
'4.6', '5.0', '5.5', '6.0',
'6.5', '7.0']
petal_width = ['3.6', '3.8', '4.4', '6.6',
'6.8', '7.0', '7.5', '8.0',
'8.5', '8.9']
df = pd.DataFrame({'petal_length(cm)': petal_length,
'petal_width(cm)': petal_width})
df['petal_length(cm)'] = df['petal_length(cm)'].astype(float)
df['petal_width(cm)'] = df['petal_width(cm)'].astype(float)
df.plot(x='petal_length(cm)', y='petal_width(cm)')
plt.show()
|
Output:
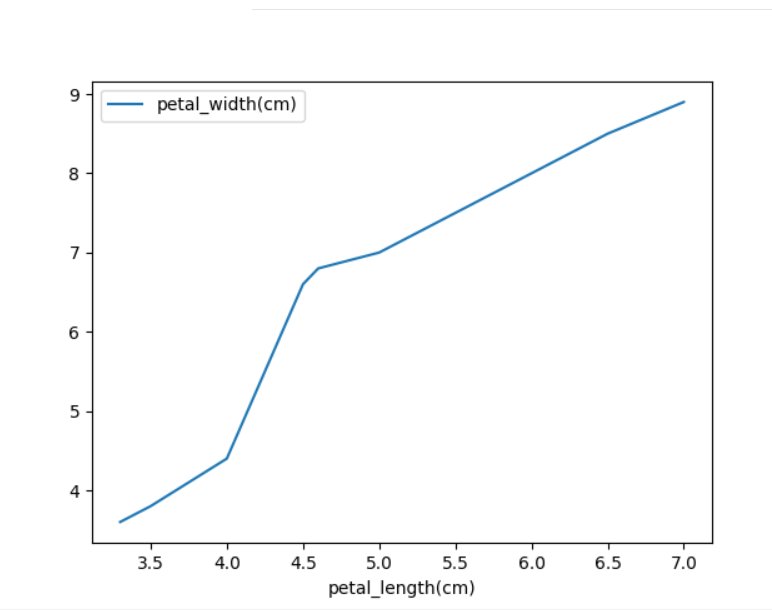
Method 2 :Using to_numeric() function
Syntax:
df['column_name'] = pd.to_numeric(df['column_name'])
where df is the input dataframe
Example:
Python3
import pandas as pd
import numpy as np
import matplotlib.pyplot as plt
petal_length = ['3.3', '3.5', '4.0', '4.5',
'4.6', '5.0', '5.5', '6.0',
'6.5', '7.0']
petal_width = ['3.6', '3.8', '4.4', '6.6',
'6.8', '7.0', '7.5', '8.0',
'8.5', '8.9']
df = pd.DataFrame({'petal_length(cm)': petal_length,
'petal_width(cm)': petal_width})
df['petal_length(cm)'] = pd.to_numeric(df['petal_length(cm)'])
df['petal_width(cm)'] = pd.to_numeric(df['petal_width(cm)'])
df.plot(x='petal_length(cm)', y='petal_width(cm)')
plt.show()
|
Output:
Like Article
Suggest improvement
Share your thoughts in the comments
Please Login to comment...