How to Fix in R: plot.new has not been called yet
Last Updated :
23 May, 2022
In this article, we will discuss how to fix the “plot.new has not been called yet” error in the R programming language.
The R compiler produces such an error when we try to carry an operation that requires a plot to exist in R but the plot doesn’t exist yet.
Error in plot.xy(xy.coords(x, y), type = type, ...) :
  plot.new has not been called yet
Method 1: How to fix with lines() function
Here we will focus on how we can fix the error that can be produced by the R compiler while dealing with the lines() function.
Example:
Let’s consider an example, we have two vectors that hold the corresponding X and Y coordinates of 12 different points. Then we have used the lines() function to draw lines joining the points.
R
x <- c(1.7, 2.7, 3.7, -3.7, -5.7,
3.7, 5.7, 4.8, 10.3, -12.9, 13.8, 12.3)
y <- c(1.2, 2.3, 3.2, -3.5, -3.2, 2.1,
4.7, .8, 1.2, 11.5, 1.3, 3.2)
lines(x, y, col = "red")
|
Output:
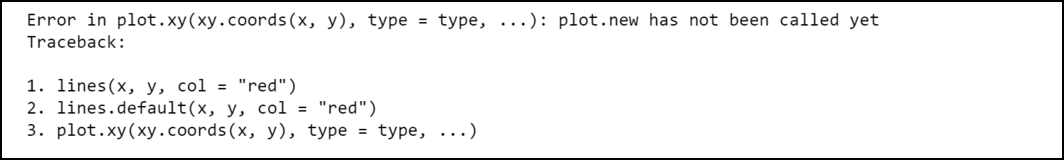
The R compiler produces such an error because we didn’t create the plot before using the lines() function. We can fix this error easily by creating a plot before using the lines() function:
Example:
Here, in this example, we are fixing the above error by simply calling the plot function before the lines() function to get the idea of the points given.
R
x <- c(1.7, 2.7, 3.7, -3.7, -5.7,
3.7, 5.7, 4.8, 10.3, -12.9, 13.8, 12.3)
y <- c(1.2, 2.3, 3.2, -3.5, -3.2, 2.1,
4.7, .8, 1.2, 11.5, 1.3, 3.2)
plot(x, y, cex = 1, pch = 3,
xlab ="x", ylab ="y",
col ="black")
lines(x, y, col = "red")
|
Output:
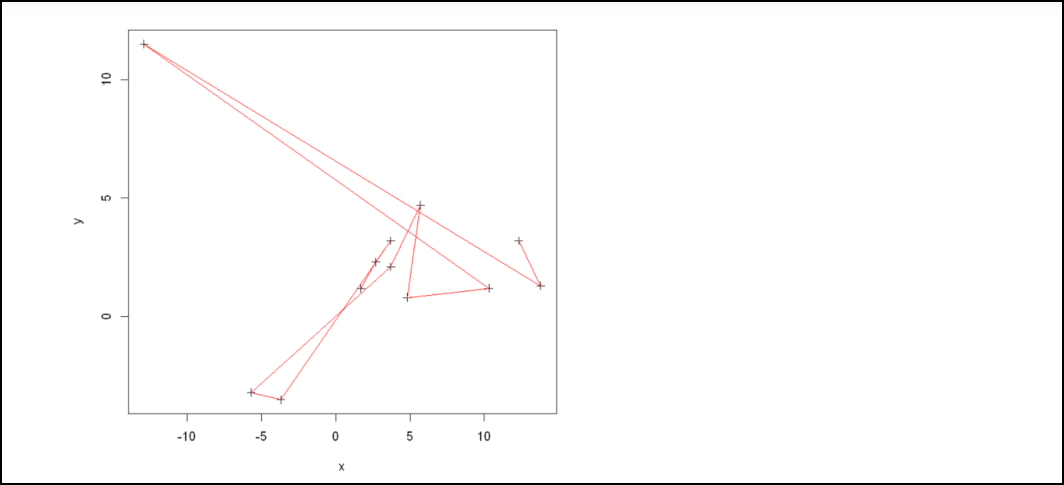
This time the program compiled successfully because we have created the plot before using the lines() function.
Method 2: How to fix with abline() function:
In this part, we focus on how we can fix the error that can be produced by the R compiler while dealing with the abline() function.
Example:
Let’s consider an example, we have two vectors that hold the corresponding X and Y coordinates of 12 different points. Then we have used the ablines() function to draw a horizontal line at Y = 5.
R
x <- c(1.7, 2.7, 3.7, -3.7, -5.7,
3.7, 5.7, 4.8, 10.3, -12.9, 13.8, 12.3)
y <- c(1.2, 2.3, 3.2, -3.5, -3.2, 2.1,
4.7, .8, 1.2, 11.5, 1.3, 3.2)
abline(a=5, b=0, lwd=3)
|
Output:

The R compiler produces such an error because we didn’t create the plot before using the abline() function. We can fix this error easily by creating a plot before using the abline() function:
Example:
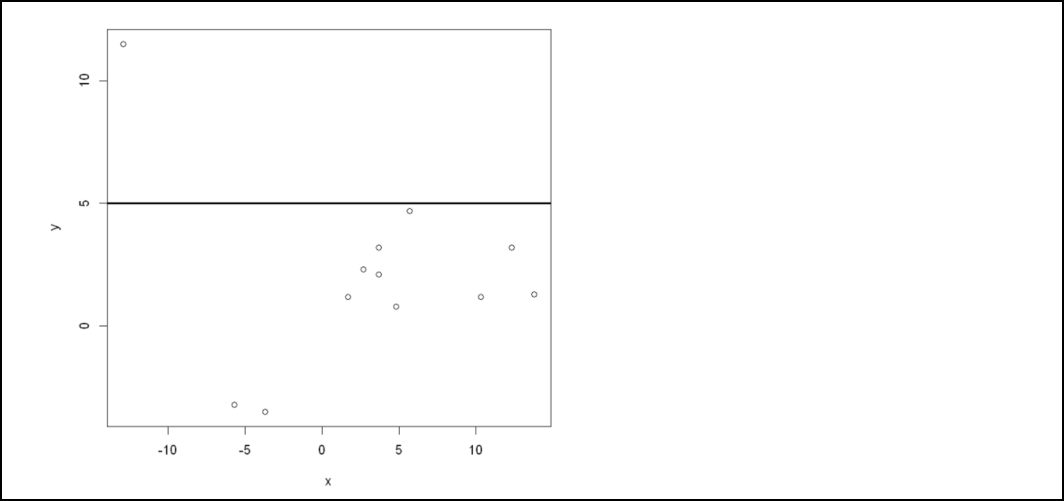
So, here for resolving the above error, we are calling the plot() function before the abline function with the given parameters, and by this, the program compiled successfully without any error.
R
x <- c(1.7, 2.7, 3.7, -3.7, -5.7,
3.7, 5.7, 4.8, 10.3, -12.9, 13.8, 12.3)
y <- c(1.2, 2.3, 3.2, -3.5, -3.2, 2.1,
4.7, .8, 1.2, 11.5, 1.3, 3.2)
plot(x, y, cex = 1, pch = 3,
xlab ="x", ylab ="y",
col ="black")
abline(a=5, b=0, lwd=3)
|
Output:
Like Article
Suggest improvement
Share your thoughts in the comments
Please Login to comment...