How to Fix in R: Contrasts can be applied only to factors with 2 or more levels.
Last Updated :
18 Mar, 2022
In this article, we will discuss how we can fix “contrasts can be applied only to factors with 2 or more levels” error in the R programming language.
Contrasts can be applied only to factors with 2 or more levels:
It is a common error produced by the R compiler. The complete form of this error is given below:
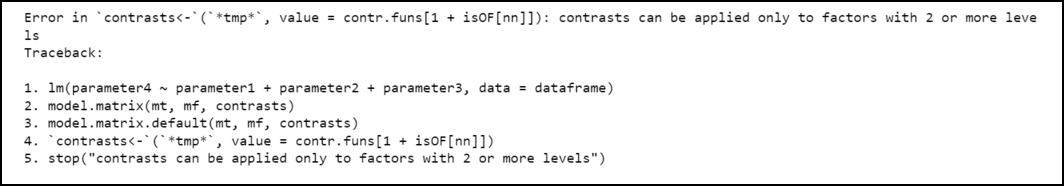
Error in `contrasts<-`(`*tmp*`, value = contr.funs[1 + isOF[nn]]) :
contrasts can be applied only to factors with 2 or more levels
Such an error is produced by the R compiler when we try to fit a regression model with the help of the predictor variable that is either a character or factor and contains only one unique value.
When this error might occur:
R
dataframe <- data.frame(parameter1=c(8, 1, 13, 24, 9),
parameter2=as.factor(6),
parameter3=c(17, 9, 18, 13, 12),
parameter4=c(12, 21, 32, 4, 19))
dataframe
|
Output:
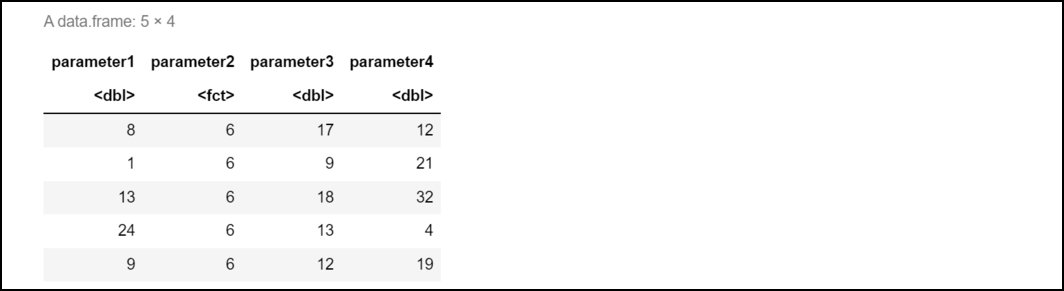
As you can see in the above code, parameter2 is a factor has contains only a unique value. If we try to fit a multiple regression model in which parameter2 serves the purpose of a predictor variable then the compiler produces the following error:
Example:
Here, the R compiler produces this kind of error because parameter2 contains only one unique value in it that is equal to 6. Since no variation exists at all in this predictor variable hence R compiler couldn’t fit a regression model effectively.
R
dataframe <- data.frame(parameter1=c(8, 1, 13, 24, 9),
parameter2=as.factor(6),
parameter3=c(17, 9, 18, 13, 12),
parameter4=c(12, 21, 32, 4, 19))
model <- lm(parameter4 ~ parameter1 + parameter2 +
parameter3, data=dataframe)
|
Output:
How to fix this error:
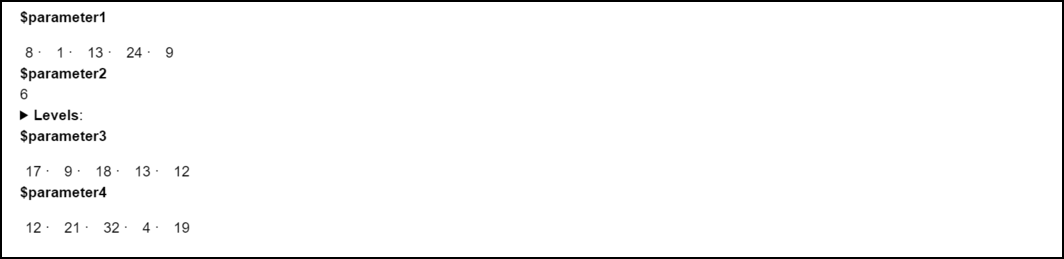
Note that we can use the sapply() and lapply() functions together to count the number of unique values present in each of the predictor variables.
Example:
Here, Using lapply() function we can even print the values present in the individual predictor variables.
R
dataframe <- data.frame(parameter1=c(8, 1, 13, 24, 9),
parameter2=as.factor(6),
parameter3=c(17, 9, 18, 13, 12),
parameter4=c(12, 21, 32, 4, 19))
sapply(lapply(dataframe, unique), length)
|
Output:

Output
Example:
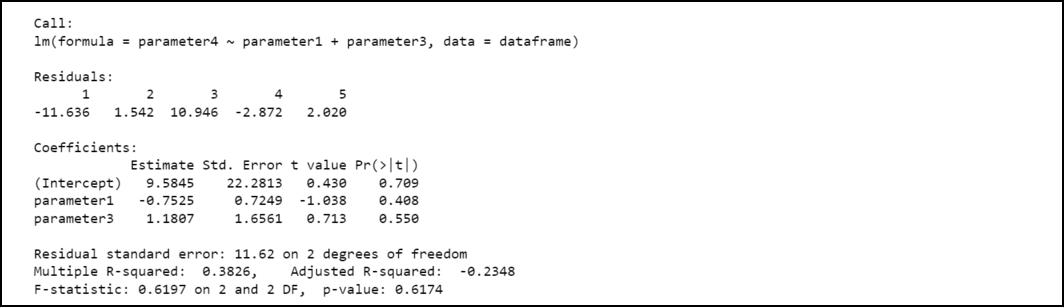
Now from the below code, we can see that parameter2 contains only one unique value. Hence, we can fix this error by simply removing parameter2 from the regression model.
R
dataframe <- data.frame(parameter1=c(8, 1, 13, 24, 9),
parameter2=as.factor(6),
parameter3=c(17, 9, 18, 13, 12),
parameter4=c(12, 21, 32, 4, 19))
lapply(dataframe[c('parameter1', 'parameter2',
'parameter3', 'parameter4')],
unique)
|
Output:
Example:
Hence, by removing parameter2, the program compiled successfully without any error.
R
dataframe <- data.frame(parameter1=c(8, 1, 13, 24, 9),
parameter2=as.factor(6),
parameter3=c(17, 9, 18, 13, 12),
parameter4=c(12, 21, 32, 4, 19))
model <- lm(parameter4 ~ parameter1 + parameter3, data=dataframe)
summary(model)
|
Output:
Like Article
Suggest improvement
Share your thoughts in the comments
Please Login to comment...