How to find group-wise summary statistics for R dataframe?
Last Updated :
21 Apr, 2021
Finding group-wise summary statistics for the dataframe is very useful in understanding our data frame. The summary includes statistical data: mean, median, min, max, and quartiles of the given dataframe. The summary can be computed on a single column or variable, or the entire dataframe. In this article, we are going to see how to find group-wise summary statistics for data frame in R Programming Language.
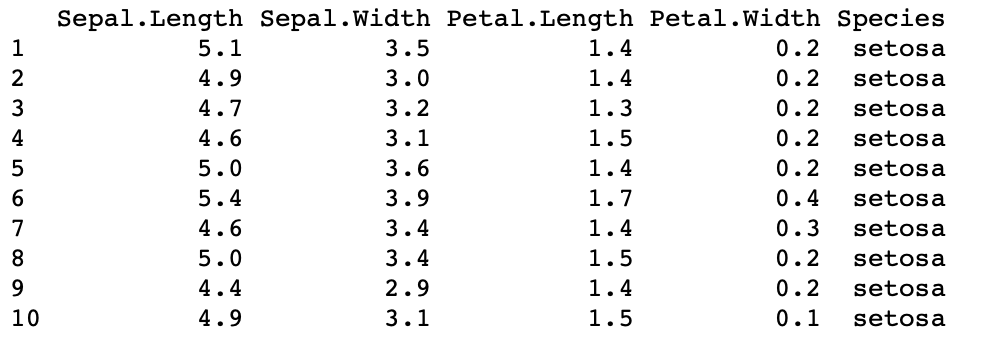
In the code below we have used a built-in data set: iris flower dataset. Then we can inspect our dataset by using the head() or tail() function which will print the top and bottom part of the dataframe. In the code below, we have displayed the top 10 rows of our sample dataframe.
Output:
Summary of single variable or column
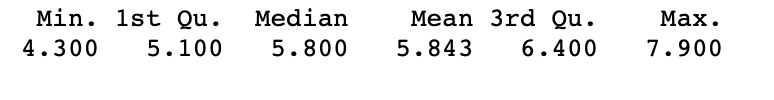
Our dataframe is stored in the “df” variable. We want to print the summary of the column: Sepal.Length. So, we pass “df$Sepal.length” as an argument in the summary() function.
Syntax: summary(dataframe$column_name)
The summary() function takes in a dataframe column and returns:
- Central Tendency-> mean and median,
- Interquartile range-> 25th and 75th quartiles,
- Range-> min, and max values for that single column.
Example 1:
R
df <- iris
summary(df$Sepal.Length)
|
Output:
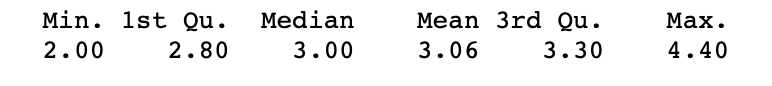
Example 2: We can also pass the “digits” as an argument which specifies up to how many decimal places we want to correct our output values
Syntax: summary(dataframe$column_name , digits=number_of_decimal_places)
R
df <- iris
summary(df$Sepal.Width, digits = 3)
|
Output:
Summary of entire dataframe
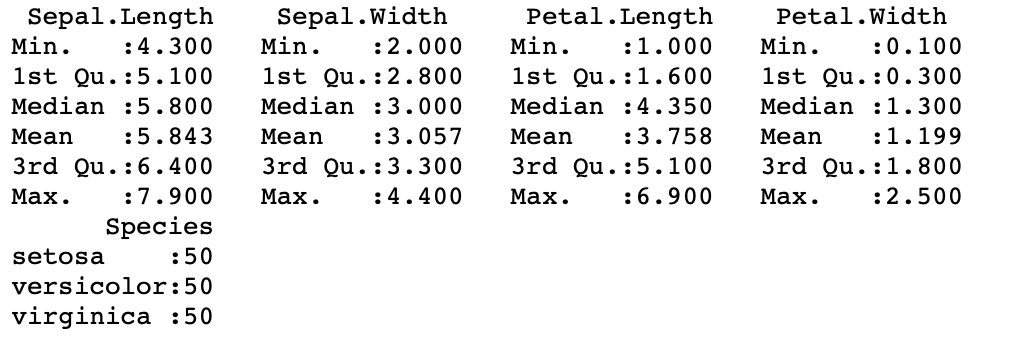
In the code below, we have passed the entire dataframe as an argument in the summary() function, so it computes a summary of the entire dataframe(all the columns or variables)
Syntax: summary(dataframe_name)
Output:
Group-wise summary of data
For a better understanding of Dataframe in R, it is recommended to refer R – Data Frames article.
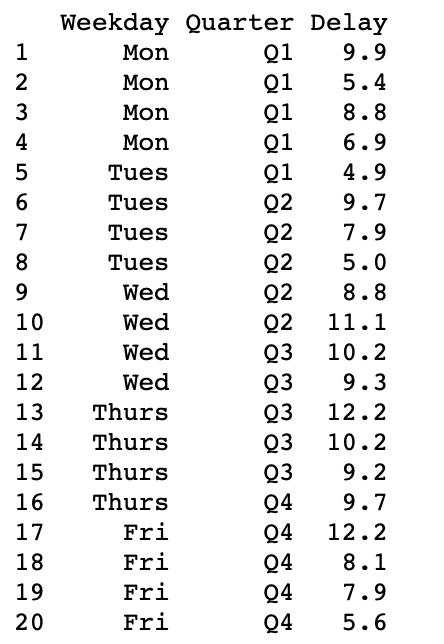
Let’s create a sample dataframe first:
R
df <- data.frame(
Weekday = factor(rep(c("Mon", "Tues", "Wed",
"Thurs", "Fri"), each = 4),
levels = c("Mon", "Tues", "Wed",
"Thurs", "Fri")),
Quarter = paste0("Q", rep(1:4, each = 5)),
Delay = c(9.9, 5.4, 8.8, 6.9, 4.9, 9.7, 7.9, 5, 8.8,
11.1, 10.2, 9.3, 12.2, 10.2, 9.2, 9.7, 12.2,
8.1, 7.9, 5.6))
df
|
Output:
Summarising group-wise data of Single Variable
Our data frame consists of 3 variables: Week-day, Quarter, and Delay. The variable which we will be summarising is Delay and in the process, Quarter variable will be collapsed.
In the below code, we will be using dplyr package. The dplyr package in R is a structure of data manipulation that provides a uniform set of verbs, helping to resolve the most frequent data manipulation hurdles. We will be performing a grouping operation using the group_by() function and a summary operation using the summarize() function. Then we will calculate 2 statistical summaries: maximum delay time and minimum delay time.
Syntax: group_by(variable_name)
R
library(dplyr)
df <- data.frame(
Weekday = factor(rep(c("Mon", "Tues", "Wed", "Thurs",
"Fri"), each = 4),
levels = c("Mon", "Tues", "Wed", "Thurs",
"Fri")),
Quarter = paste0("Q", rep(1:4, each = 5)),
Delay = c(9.9, 5.4, 8.8, 6.9, 4.9, 9.7, 7.9, 5, 8.8,
11.1, 10.2, 9.3, 12.2, 10.2, 9.2, 9.7, 12.2,
8.1, 7.9, 5.6))
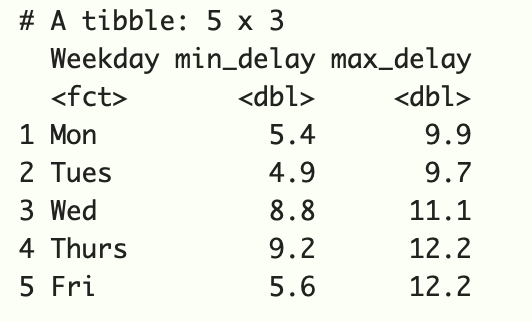
df %>%
group_by(Weekday) %>%
summarize(min_delay = min(Delay), max_delay = max(Delay))
|
Output:
Summarising group-wise data of Multiple Variable
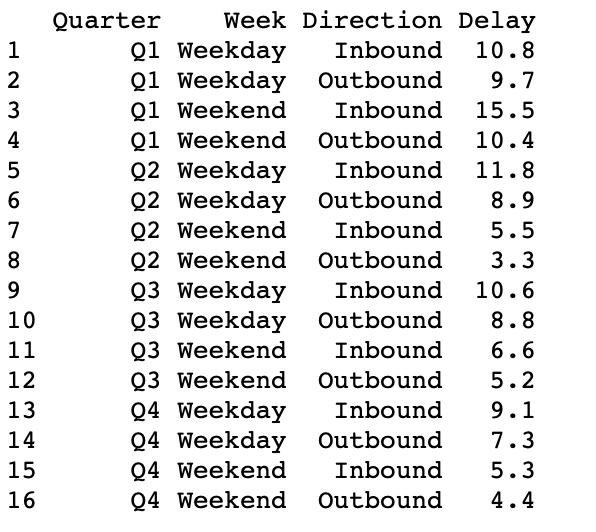
Let’s create another sample dataframe ->df2:
R
df2 <- data.frame(
Quarter = paste0("Q", rep(1:4, each = 4)),
Week = rep(c("Weekday", "Weekend"), each=2, times=4),
Direction = rep(c("Inbound", "Outbound"), times=8),
Delay = c(10.8, 9.7, 15.5, 10.4, 11.8, 8.9, 5.5,
3.3, 10.6, 8.8, 6.6, 5.2, 9.1, 7.3, 5.3, 4.4))
df2
|
Output:
Summarizing data group-wise:
In this case, our dataframe is having 4 variables: Quarter, Week, Direction, Delay. In the code below, we have grouped and summarised by Quarter and Week, and in the process, the variable Direction is collapsed.
Syntax: group_by(variable_name1,variable_name2 )
R
library(dplyr)
df2 <- data.frame(
Quarter = paste0("Q", rep(1:4, each = 4)),
Week = rep(c("Weekday", "Weekend"), each=2, times=4),
Direction = rep(c("Inbound", "Outbound"), times=8),
Delay = c(10.8, 9.7, 15.5, 10.4, 11.8, 8.9, 5.5,
3.3, 10.6, 8.8, 6.6, 5.2, 9.1, 7.3, 5.3, 4.4))
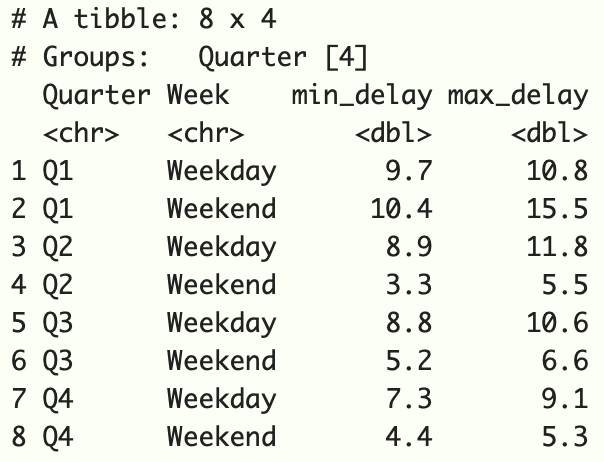
df2 %>%
group_by(Quarter, Week) %>%
summarize(min_delay = min(Delay), max_delay = max(Delay))
|
Output:
Like Article
Suggest improvement
Share your thoughts in the comments
Please Login to comment...