How to do groupby on a multiindex in Pandas?
Last Updated :
09 Jun, 2022
In this article, we will be showing how to use the groupby on a Multiindex Dataframe in Pandas. In Data science when we are performing exploratory data analysis, we often use groupby to group the data of one column based on the other column. So, we are able to analyze how the data of one column is grouped or depending based upon the other column. There is also an alternative to groupby, we can also use a Pivot Table.
A groupby operation involves some combination of splitting the object, applying a function, and combining the results. This can be used to group large amounts of data and compute operations on these groups. Any groupby operation involves one of the following operations on the original DataFrame. They are as follows:
- Splitting the object.
- Combining the Output.
- Applying a function.
Syntax:
DataFrame.groupby(by=None, axis=0, level=None, as_index=True, sort=True,
                 group_keys=True, squeeze=False, **kwargs)
Parameters:
- by: mapping, function, label or list of tables
- axis: { 0 or ‘index’, 1 or ‘columns’}, default 0
- level: level name
- sort: bool, default True
Return Type : DataFrameGroupBy
We have to pass the name of indexes, in the list to the level argument in groupby function. The ‘region’ index is level (0) index, and ‘state’ index is level(1) index. In this article, we are going to use this CSV file.
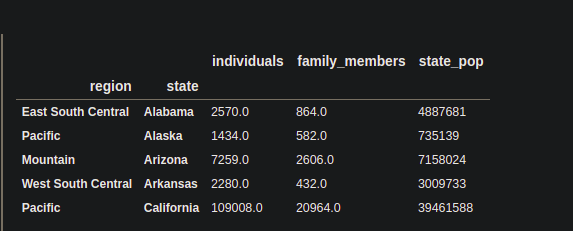
Let’s Look into the CSV file
Python3
import pandas as pd
df = pd.read_csv('homelessness.csv')
print(df.head())
|
Output:

Columns in the DataFrame: We can know the columns of the DataFrame by using the Pandas columns attribute.
Python3
col = df.columns
print(col)
|
Output:

As there is no indexing in the DataFrame, we can say this DataFrame has no index. First, we have to make this DataFrame, Multi index DataFrame, or Hierarchical index DataFrame.
Multi-indexing: The DataFrame which has more than one index is called Multi-index DataFrame. To know more about the multi-index DataFrame, how to make the DataFrame multi-indexed and how to use multi-indexed DataFrame for data exploration, you can refer this article.
To, Make the DataFrame multi-indexed, we will be going to use the Pandas set_index() function. We are going to make the ‘region‘ and ‘state‘ columns of the Dataframe the index.
Example
Python3
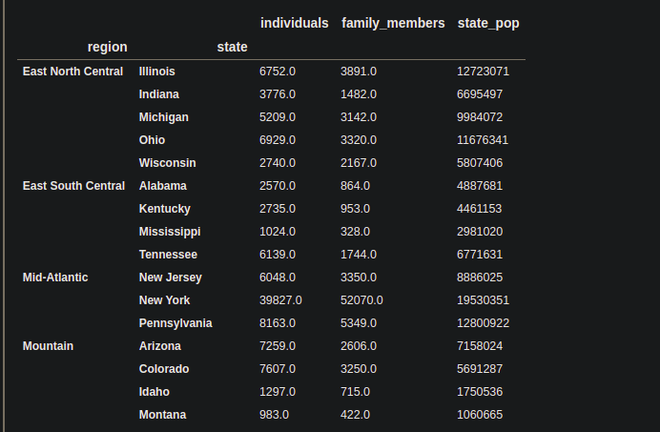
df = df.set_index(['region' , 'state'])
df.sort_index()
print(df.head())
|
Output:
Now, the DataFrame is a multi-indexed DataFrame having the ‘region‘ and ‘state‘ columns as an index.
Using Groupby operation on the Multi-index DataFrame:
Here we will represent the levels with the numbering index starting from 0.
Python3
df.groupby(level=[0,1]).sum()
|
Output:
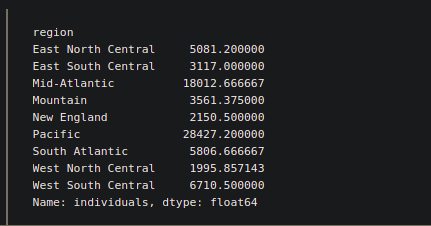
Instead of the level number, we can also pass the names of the columns.
Python3
y = df.groupby(level=['region'])['individuals'].mean()
print(y)
|
Output:
We can also some methods with groupby to explore more.
1. apply() in groupby:
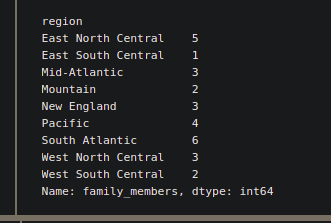
Suppose we want to know how many states of each region, have a ‘family_members’ more than 1000. For this kind of problem statement, we can use apply(). Inside apply(), we have to pass the kind of function, which is specially designed for a particular task. So, in this case, we are going to use the lambda function, which is a great way to write functions in one line.
Example:
Python3
import numpy as np
fam_1000 = df.groupby(
level=["region"])["family_members"].apply(lambda x : np.sum(x>1000))
print(fam_1000)
|
Output:
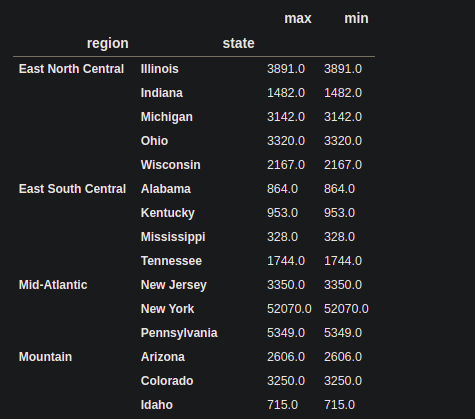
2. agg() in groupby:
The agg() function can be used for performing some statistical operation like min(), max() , mean() etc. If we want to perform more than one statistical operation at a time, then we can pass them in the list.
Python3
df_agg = df.groupby(
level=["region", "state"])["state_pop"].agg(["max", "min"])
print(df_agg)
|
Output:
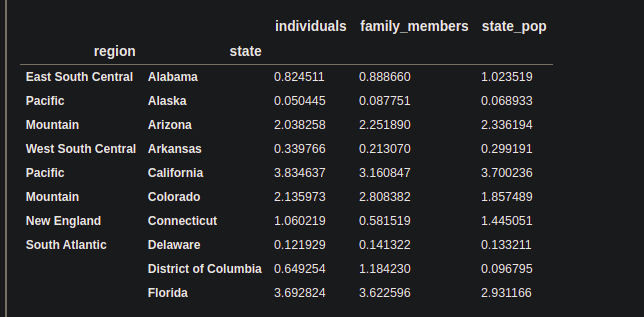
3. transform() in groupby:
The transform() is used to transform the columns, under a given condition. Inside the transform function, we have to pass the function that will responsible for performing a special task. We are going to use the lambda function.
Example:
Python3
score = (lambda x : (x / x.mean()))
df_tra = df.groupby(level=["region"]).transform(score)
print(df_tra.head(10))
|
Output:
Note: There is an alternative of groupby operation, Pivot_table which is also used to group the first column based on the others’ columns, but a pivot table can be more useful if we want to analyze groups statistically.
Like Article
Suggest improvement
Share your thoughts in the comments
Please Login to comment...