How To Customize Border in facet plot in ggplot2 in R
Last Updated :
05 Nov, 2021
In this article, we will discuss how to customize the border in the facet plot in ggplot2 in R Programming language.
Facet plots, where one subsets the data based on a categorical variable and makes a series of similar plots with the same scale. Facetting helps us to show the relationship between more than two categories of data. When we have multiple variables, with faceting it can be plotted in a single plot into smaller plots.
We can easily plot a facetted plot using the facet_wrap() function of the ggplot2 package. When we use facet_wrap() in ggplot2, by default it gives a title in a grey box.
Syntax: plot + facet_wrap( ~facet-variable)
Where:
- facet-variable: determines the variable around which plots have to be divided.
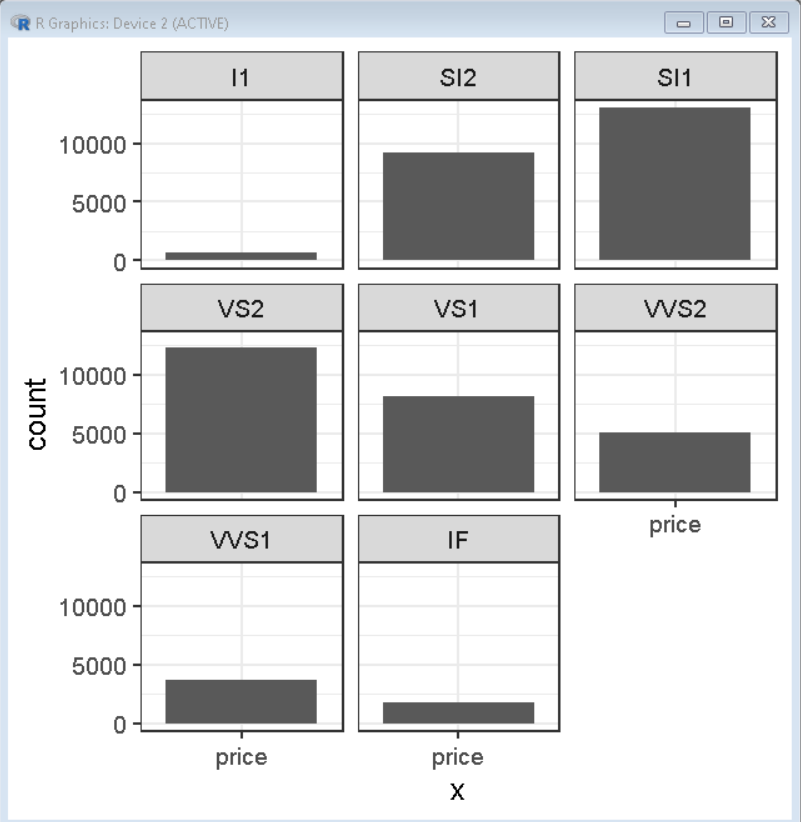
Creating a basic facet plot
Here, is a basic facet plot made using the diamonds data frame which is provided by R Language natively. We have used the facet_wrap() function with ~cut to divide the plot into facets according to their clarity.
R
library(tidyverse)
theme_set(theme_bw(18))
ggplot(diamonds, aes(x="price")) +
geom_bar()+
facet_wrap(~clarity)
|
Output:
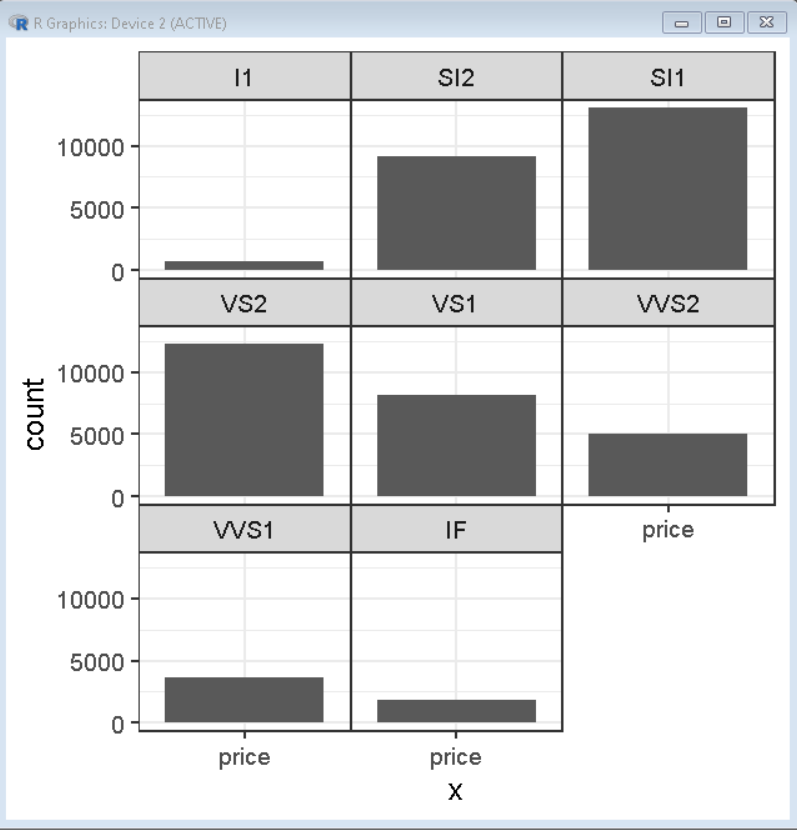
Remove Space between panels in facet plot
To remove the space between panels we use panel.spacing.x / panel.spacing.y argument of theme() function. We can even manually specify the amount of space needed between the panels using this method.
Syntax: plot + theme( panel.spacing.x / panel.spacing.y )
Example:
Here, we have used the diamonds dataset to create a faceted bar plot and removed space between panels by using panel.spacing.x and panel.spacing.y argument of theme() function.
R
library(tidyverse)
theme_set(theme_bw(18))
ggplot(diamonds, aes(x="price")) +
geom_bar()+
facet_wrap(~clarity)+
theme( panel.spacing.x = unit(0,"line"),
panel.spacing.y = unit(0,"line"))
|
Output:
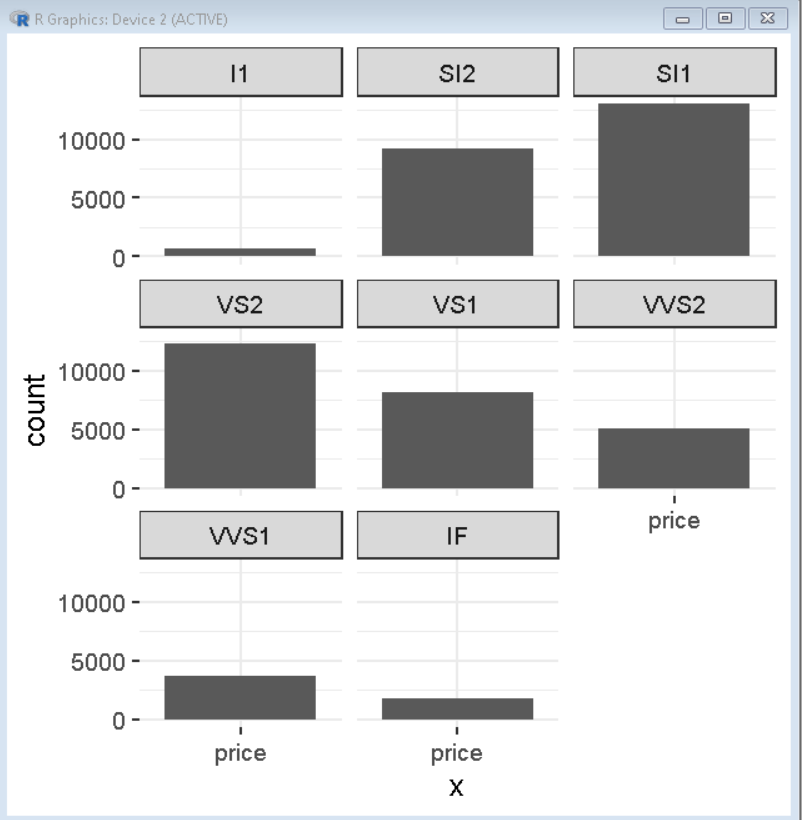
Remove Panel Border Lines in facet plots
To remove the Panel Border Lines, we use panel.border argument of theme() function. we use element.blank() function as parameter for panel.border argument to remove the border.
Syntax: plot + theme( panel.border = element_blank() )
Example:
Here, we have used the diamonds dataset to create a faceted bar plot and removed panel borders by using panel.border aselement_blank() in theme() function.
R
library(tidyverse)
theme_set(theme_bw(18))
ggplot(diamonds, aes(x="price")) +
geom_bar()+
facet_wrap(~clarity)+
theme( panel.border = element_blank() )
|
Output:
Like Article
Suggest improvement
Share your thoughts in the comments
Please Login to comment...